Market Pulse
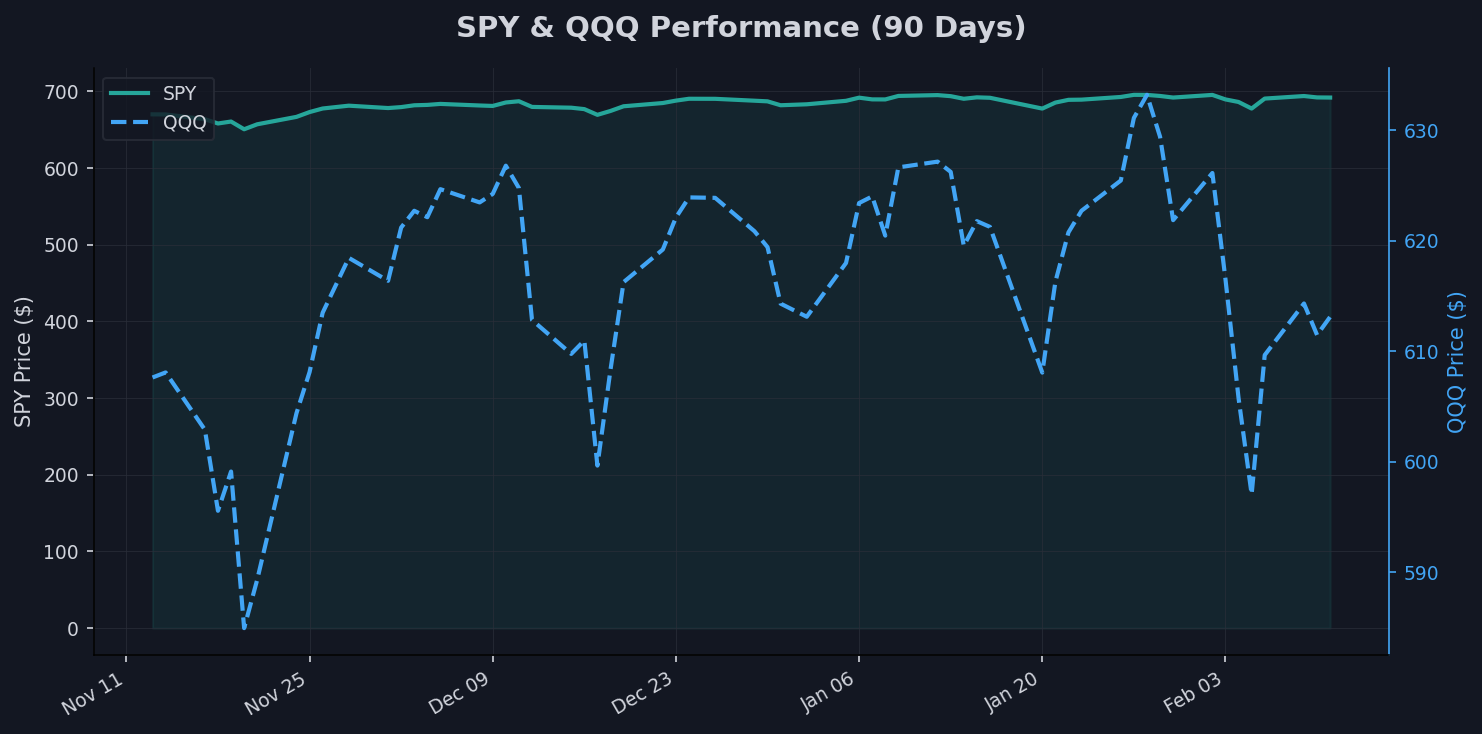
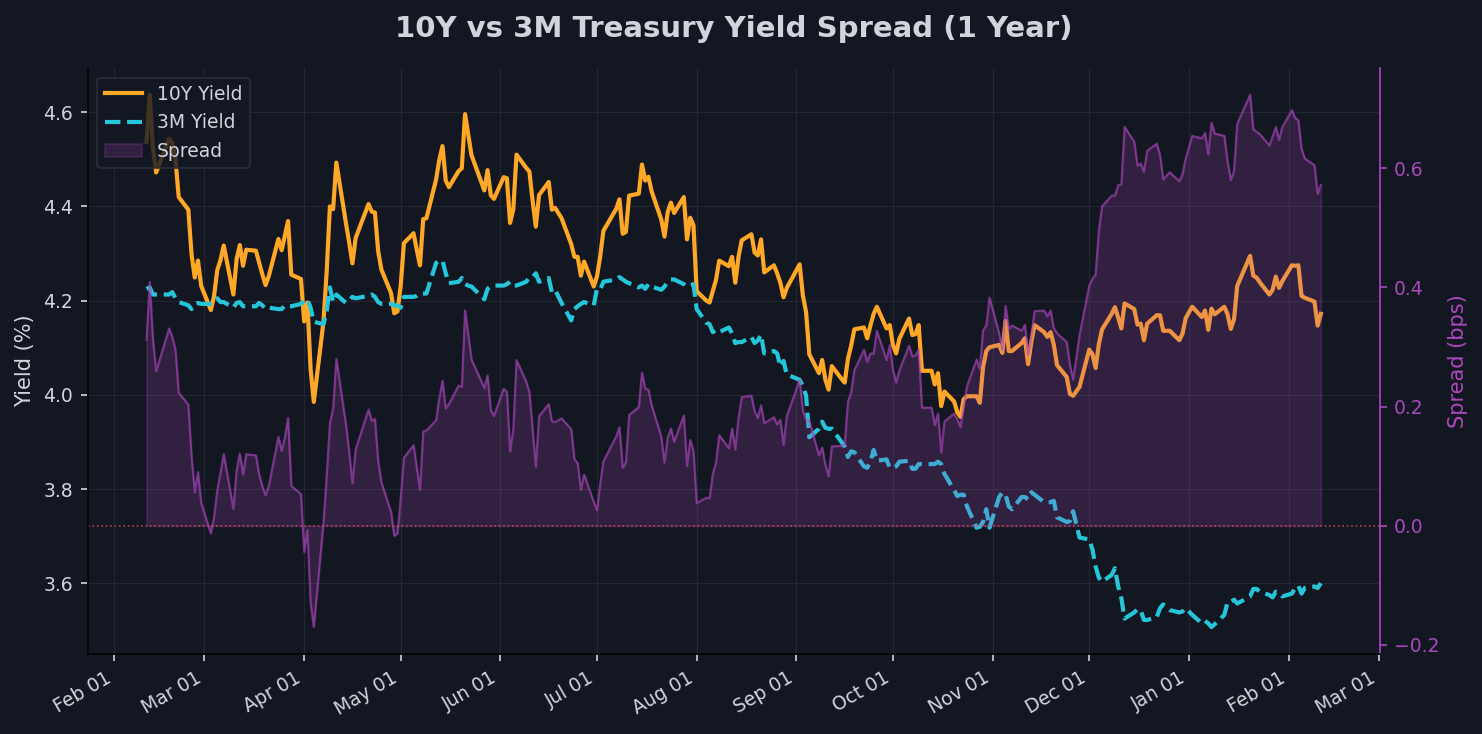
As of February 12, 2026, global markets are navigating a landscape of mixed signals, with equities demonstrating short-term stability amid broader volatility. The SPDR S&P 500 ETF (SPY) is trading at 691.96, up 0.84% over the past week but down 0.46% over the month, hovering just 0.51% below its 52-week high of 695.49. Meanwhile, the Invesco QQQ Trust (QQQ) stands at 613.11, reflecting a 1.22% weekly gain yet a sharper 2.24% monthly decline, positioned 3.44% off its 52-week peak of 634.95. Treasury yields are easing, with the 10-Year Treasury Yield (^TNX) at 4.17, down 2.41% weekly, contributing to a positive yield curve spread of 0.57% between the 10-year and 3-month rates.
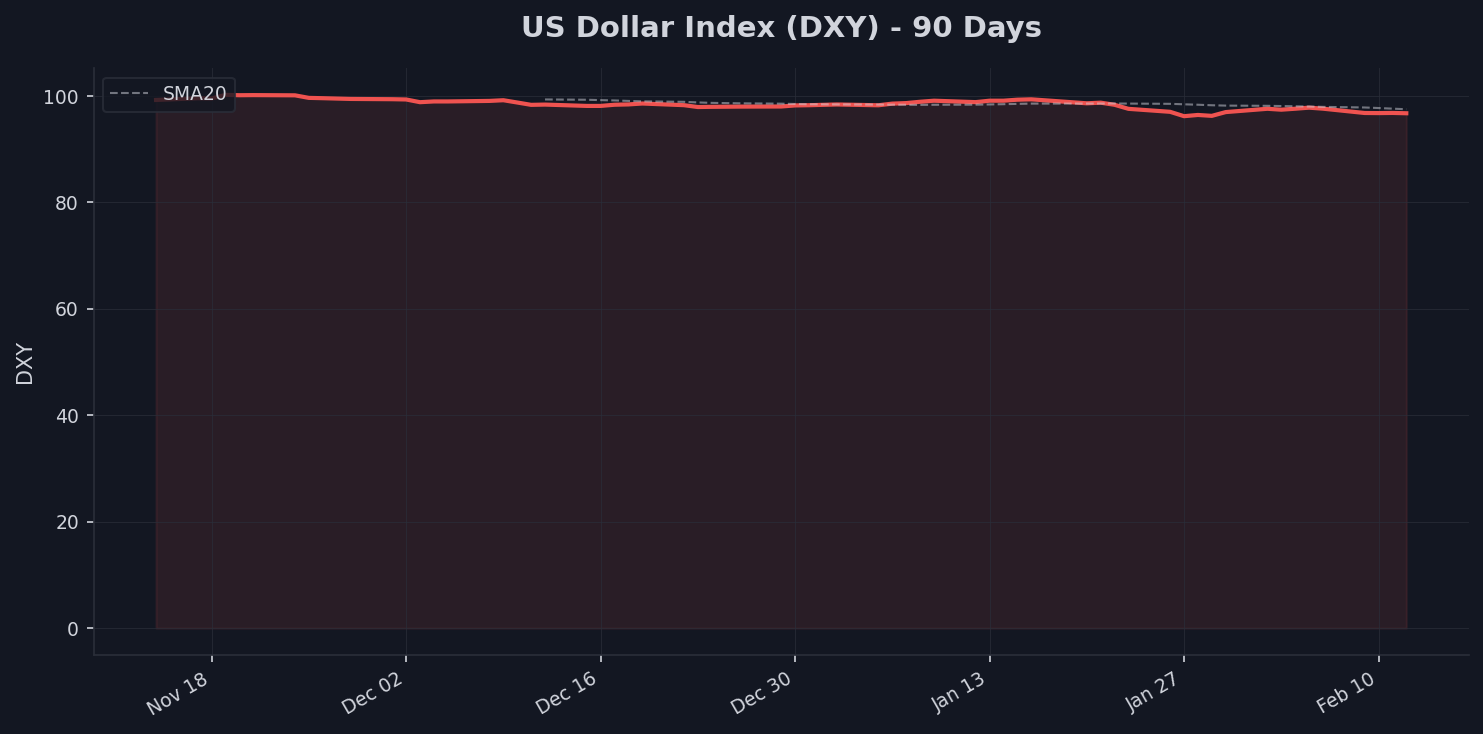
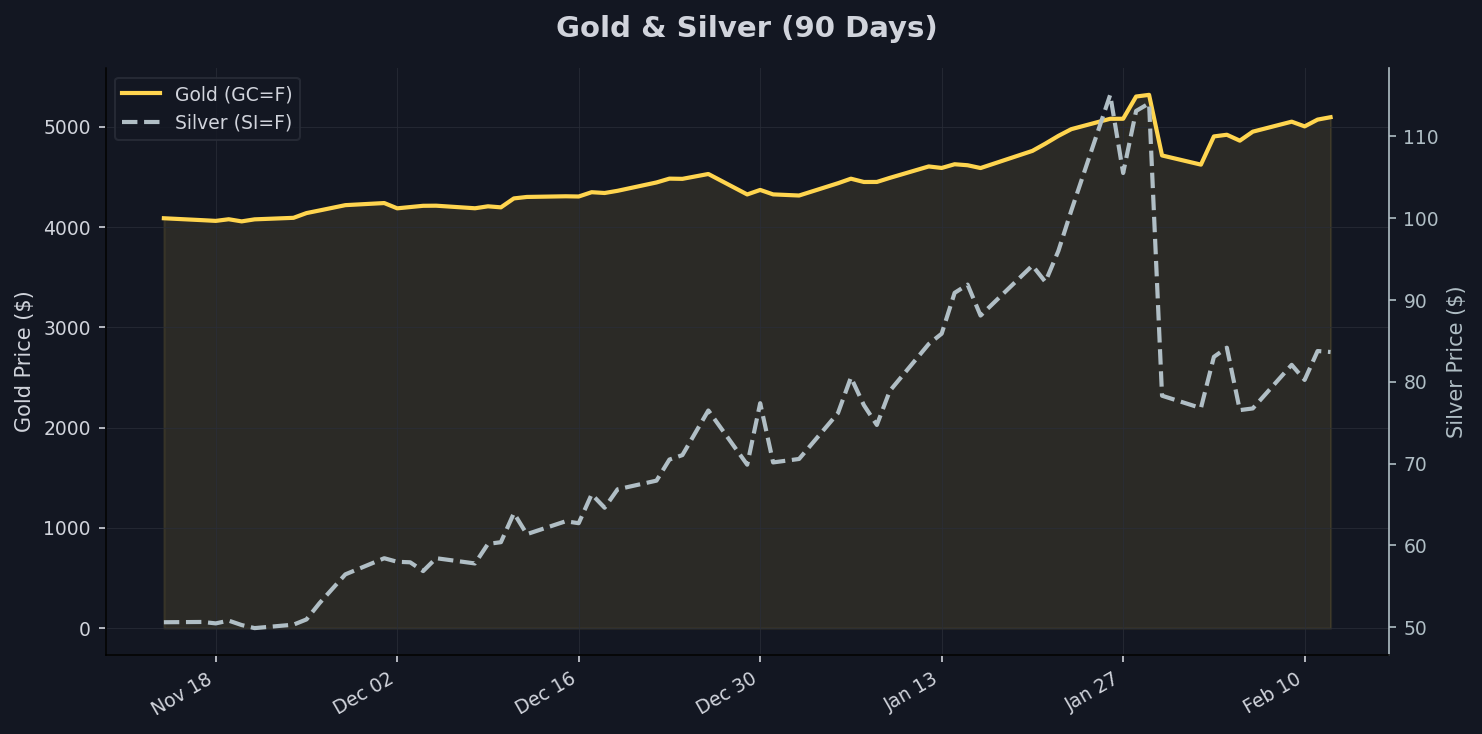
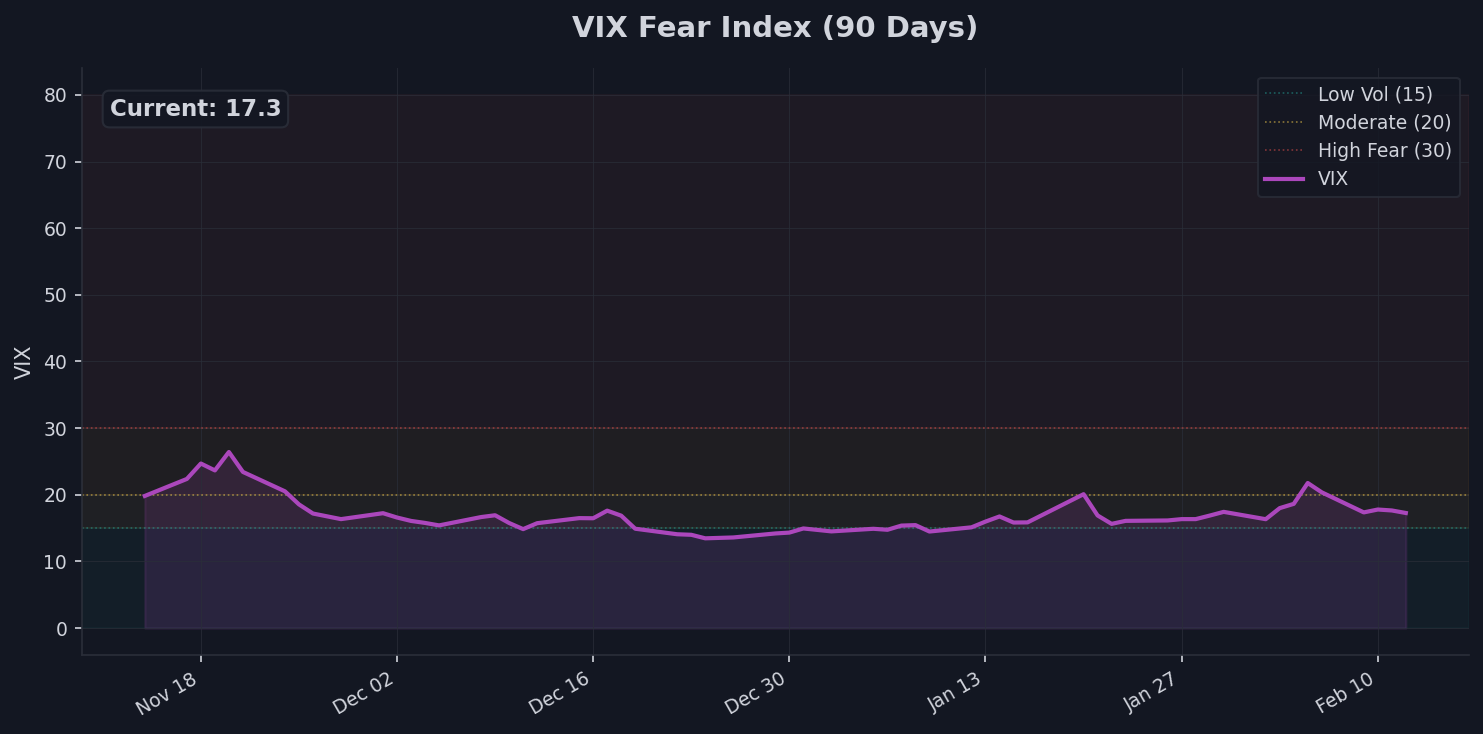
Safe-haven assets are surging, led by gold futures (GC=F) at 5095.4, which have climbed 4.81% in the last week and an impressive 24.07% over three months, though still 4.19% below the 52-week high of 5318.4. Silver futures (SI=F) are at 83.64, up 9.29% weekly but down 2.61% monthly, with a staggering 65.23% three-month gain. The US Dollar Index (DX-Y.NYB) has weakened to 96.77, down 1.07% weekly and 2.38% monthly, nearing its 52-week low of 96.22. Volatility, as measured by the CBOE Volatility Index (^VIX), has dropped to 17.27, a 20.67% weekly decline, indicating a moderation in market fear despite a 8.07% monthly increase.
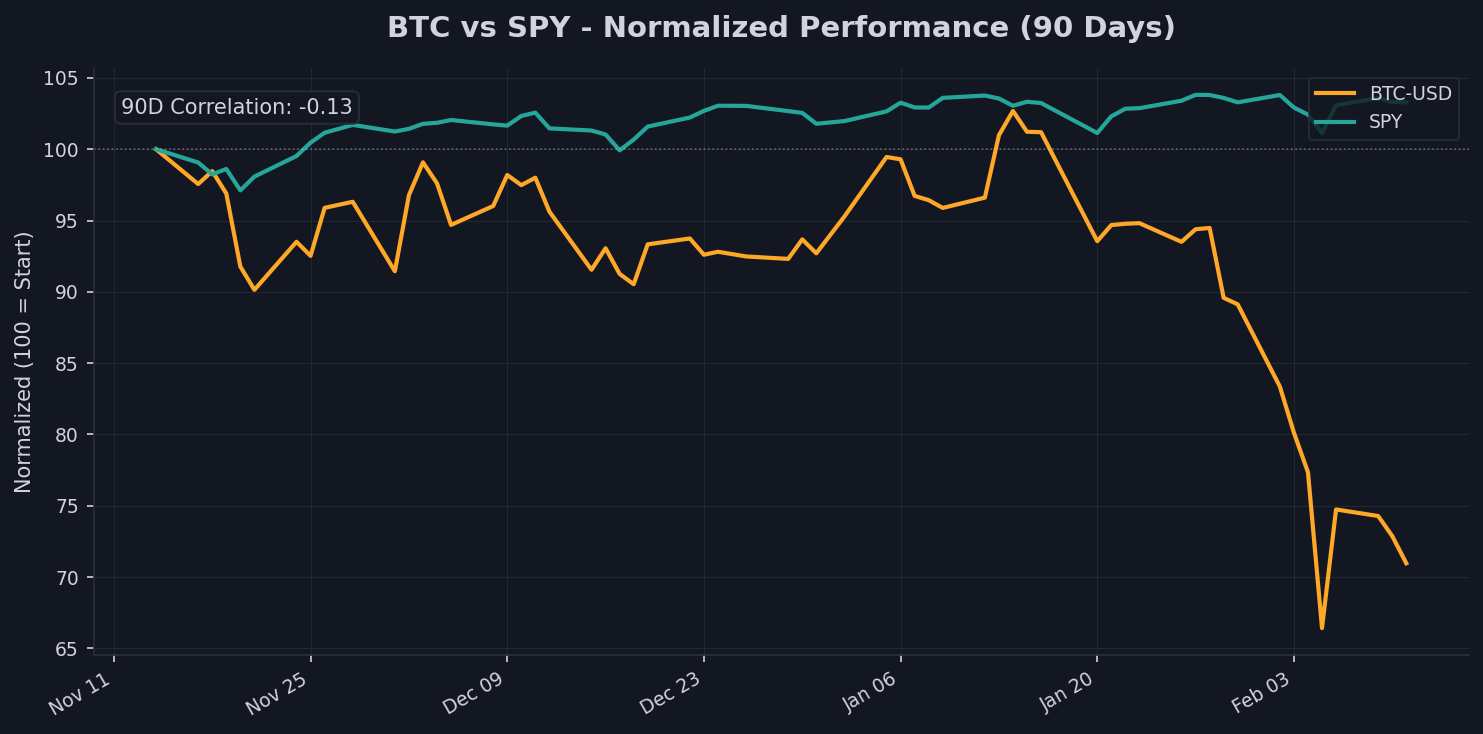
Cryptocurrencies are under pressure, with Bitcoin (BTC-USD) at 67369.59, down 2.76% weekly and a steep 24.7% monthly, trading 46.0% below its 52-week high of 124752.53. The gold/silver ratio stands at 60.9, just above the 60 threshold signaling risk-on sentiment, while the 90-day BTC/SPY correlation is -0.13, suggesting a mild decoupling. Overall, these dynamics point to a market digesting rate expectations and geopolitical uncertainties, with bonds and precious metals attracting inflows amid equity consolidation.
Equities: SPY & QQQ
The S&P 500, proxied by SPY at 691.96, exhibits resilience in the near term, with a 0.84% weekly advance and a 1.84% three-month gain, positioning it only 0.51% from its 52-week high of 695.49. Momentum indicators are supportive, as the current price sits above the 20-day SMA of 690.12, the 50-day SMA of 686.77, and well above the 200-day SMA of 644.66, suggesting sustained bullish trends despite a minor 0.46% monthly dip. This configuration implies that broader market participants are maintaining positions, potentially buoyed by expectations of softer monetary policy, though the proximity to highs warrants caution for overextension.
In contrast, the tech-heavy QQQ at 613.11 shows more pronounced weakness, with a 1.22% weekly uptick overshadowed by a 2.24% monthly decline and a 1.5% three-month drop, trading 3.44% below its 52-week high of 634.95. The price is below both the 20-day SMA of 618.28 and the 50-day SMA of 619.05 but above the 200-day SMA of 578.95, indicating short-term bearish momentum that could signal sector rotation away from growth stocks. Data suggests a potential divergence between value-oriented S&P sectors and Nasdaq's tech dominance, with investors possibly favoring defensive plays amid yield curve normalization.
Collectively, equities data points to a stabilization phase, where SPY's broad-based strength contrasts QQQ's tech vulnerability. Traders might interpret this as an opportunity for selective positioning, with the overall uptrend intact but sensitive to upcoming economic data releases that could influence rate trajectories.
Rates & Bonds
Treasury bonds are experiencing a mild rally, with the iShares 20+ Year Treasury ETF (TLT) at 88.06, up 1.76% weekly and 0.83% monthly, though down 0.55% over three months and 2.91% from its 52-week high of 90.7. The price exceeds the 20-day and 50-day SMAs, both at 87.37, and the 200-day SMA of 86.35, reflecting building momentum in long-duration bonds. This movement aligns with declining yields, as the 10-Year Treasury Yield (^TNX) falls to 4.17, a 2.41% weekly drop, sitting below its 20-day SMA of 4.22 and 200-day SMA of 4.23, but slightly below the 50-day SMA of 4.18.
The yield curve, with a 10Y-3M spread of 0.57%, remains in a normal positive configuration, having steepened from recent inversions. The 3-Month Treasury Yield (^IRX) at 3.6 is up 0.14% weekly and 1.9% monthly but down 4.84% over three months, 15.99% from its 52-week high of 4.28. This positive spread suggests diminishing recession fears, potentially supportive for equities by signaling economic expansion, though the absolute yield levels indicate markets are pricing in Federal Reserve rate cuts amid softening inflation data.
Overall, the rates environment points to a normalizing curve that could bolster risk assets, as lower long-term yields reduce borrowing costs and enhance equity valuations. However, persistent declines in short-term yields might reflect liquidity concerns, urging vigilance on economic indicators like employment and inflation for signs of further curve steepening.
Dollar Watch
The US Dollar Index (DXY) at 96.77 continues its downtrend, with a 1.07% weekly decline, 2.38% monthly drop, and 2.7% three-month slide, trading just above its 52-week low of 96.22 and 10.35% below the high of 107.94. Positioned below the 20-day SMA of 97.52, 50-day SMA of 98.16, and 200-day SMA of 98.57, the technicals confirm bearish momentum, likely driven by expectations of looser US monetary policy relative to global peers.
A weakening dollar typically boosts multinational earnings by enhancing the value of foreign revenues when repatriated, potentially supporting S&P 500 companies with significant international exposure. Conversely, it pressures commodity prices denominated in dollars, making them more affordable for non-US buyers, which could stimulate demand in emerging markets. This dynamic is evident in the surge of precious metals, as gold and silver benefit from reduced dollar strength, while emerging market equities may see inflows amid favorable currency conditions.
Looking ahead, sustained DXY weakness could amplify risks for dollar-dependent sectors but offer tailwinds for global trade. Traders should monitor central bank divergences, such as ECB or BOJ policy shifts, which might accelerate the dollar's slide and influence broader asset allocations.
Safe Havens: Gold & Silver
Gold futures (GC=F) are in a robust uptrend at 5095.4, with a 4.81% weekly gain, 11.03% monthly surge, and 24.07% three-month advance, though 4.19% below the 52-week high of 5318.4. Trading above the 20-day SMA of 4932.77, 50-day SMA of 4594.04, and 200-day SMA of 3843.79, the metal's momentum underscores its role as a hedge against uncertainty, potentially fueled by geopolitical tensions and yield declines rather than outright flight to safety.
Silver futures (SI=F) at 83.64 display even more volatility, up 9.29% weekly and an extraordinary 65.23% over three months, despite a 2.61% monthly dip and 27.32% distance from the 52-week high of 115.08. Above the 50-day SMA of 77.94 and 200-day SMA of 50.17 but below the 20-day SMA of 90.81, silver's performance suggests industrial demand alongside safe-haven appeal, diverging from gold's purer store-of-value narrative.
The gold/silver ratio at 60.9, just above the 60 threshold indicating risk-on sentiment (with above 80 signaling extreme fear), implies a market leaning toward optimism rather than panic. This ratio's position suggests precious metals are attracting rotational flows in a risk-tolerant environment, potentially signaling investor confidence in economic recovery amid dollar weakness, though elevated levels warrant watching for shifts toward fear-driven buying.
Crypto & Risk Assets
Bitcoin (BTC-USD) is under significant pressure at 67369.59, down 2.76% weekly, 24.7% monthly, and 27.18% over three months, trading 46.0% below its 52-week high of 124752.53 and well below the 20-day SMA of 76997.28, 50-day SMA of 85360.53, and 200-day SMA of 101304.05. This bearish trajectory reflects broader risk aversion in speculative assets, with BTC struggling to maintain upward momentum amid regulatory scrutiny and macroeconomic headwinds.
The 90-day correlation with SPY at -0.13 indicates a slight decoupling, suggesting BTC is not fully mirroring equity movements and may be trading more as a distinct risk asset rather than a correlated store of value. Historically viewed as digital gold, its current underperformance relative to surging physical gold (up 24.07% over three months) highlights a shift, where BTC's volatility deters safe-haven seekers in favor of traditional alternatives.
Data suggests BTC is behaving as a high-beta risk asset, sensitive to interest rate expectations and liquidity conditions. As yields fall and the dollar weakens, potential for a rebound exists if risk sentiment improves, but the deep drawdown signals caution, with traders eyeing correlation trends for signs of re-coupling with equities or further independence as a value store.
Fear Gauge: VIX
The CBOE Volatility Index (^VIX) at 17.27 has moderated significantly, dropping 20.67% over the past week despite an 8.07% monthly increase and negligible 0.06% three-month change, positioning it 67.0% below its 52-week high of 52.33 and above the low of 13.47. Trading below the 20-day SMA of 17.44 and 200-day SMA of 17.43 but above the 50-day SMA of 16.22, this level places the VIX in a moderate volatility regime, indicative of stabilized market positioning after recent spikes.
Such readings signal that investors are unwinding hedges, with implied volatility suggesting complacency rather than elevated fear. This could foreshadow continued equity stability if economic data remains supportive, though the monthly uptick warns of underlying tensions that might resurface with adverse catalysts like inflation surprises or geopolitical events.
The Bottom Line
Traders should position for potential equity upside amid normalizing yields and dollar weakness, with a focus on precious metals as hedges. Watch upcoming inflation data and central bank commentary for yield curve shifts. Key levels to monitor include SPY's 695.49 high and DXY's 96.22 low for breakout signals.