Market Pulse
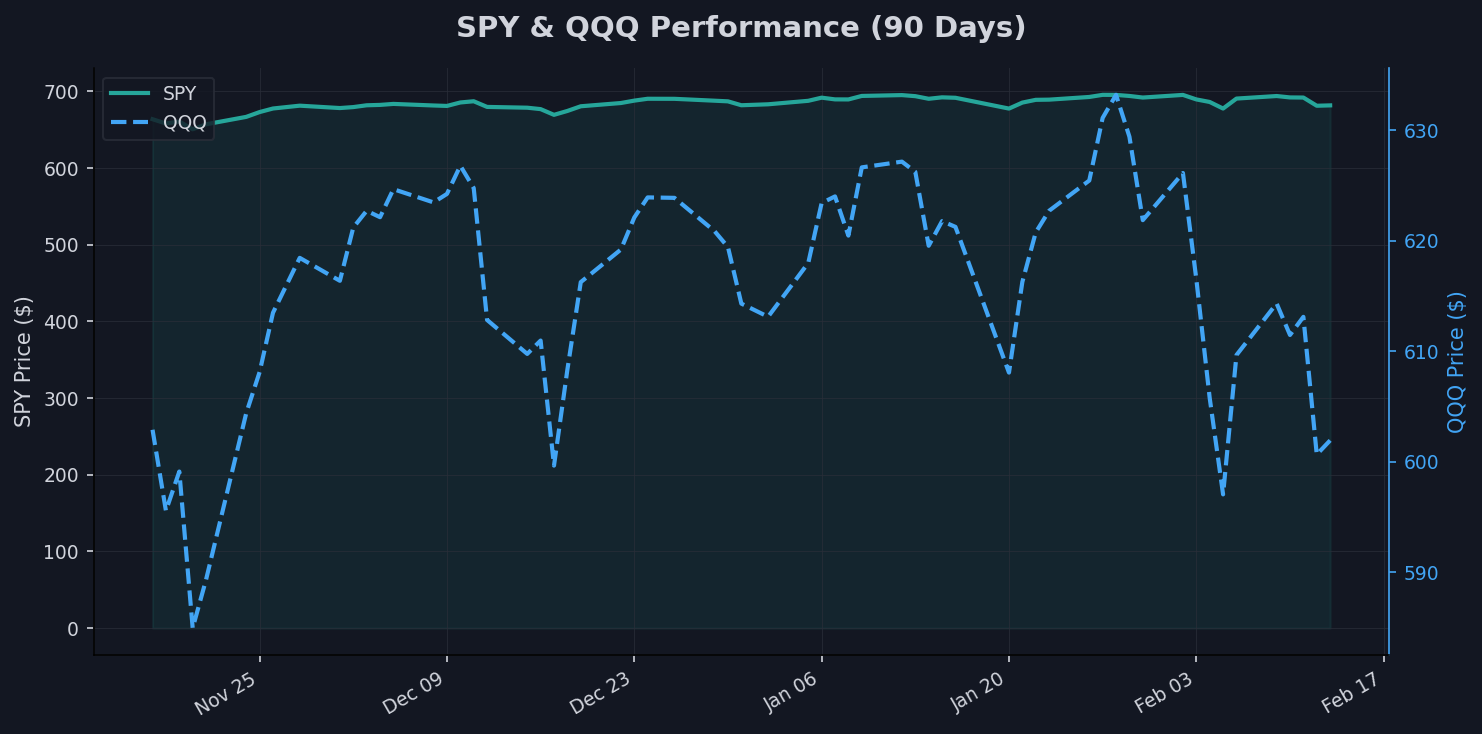
Look, the tape right now feels like that moment in a poker game when everyone starts eyeing the exits. SPY's hanging at 681.75, down 1.28% over the week and flirting with its SMA20 at 689.15, while QQQ's taken a bigger hit at 601.92, off 2.85% monthly and 5.2% from its 52-week high of 634.95. Bonds are the star of the show, with TLT popping 2.49% weekly to 89.72, as the 10-year yield dips to 4.06, down 3.57% in a week—smart money's piling into safety like it's happy hour.
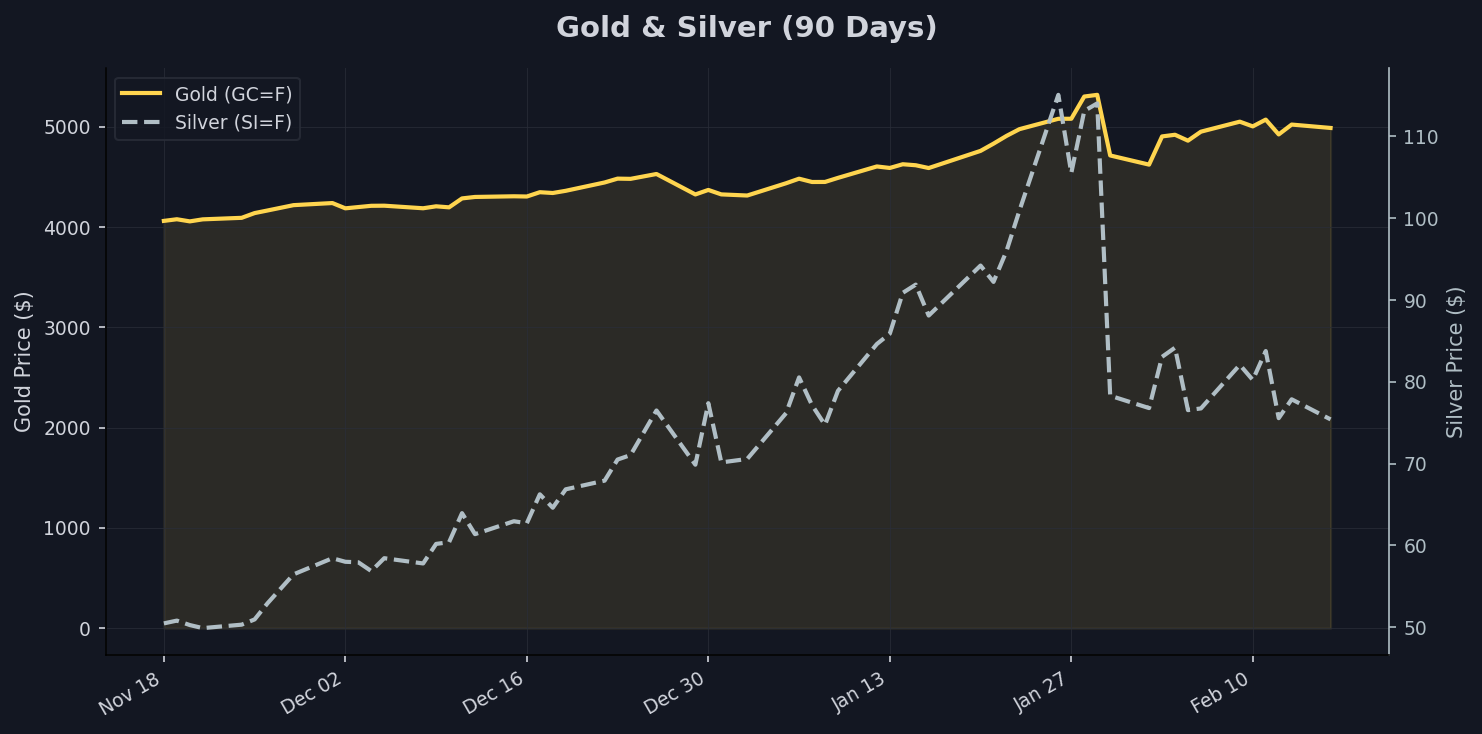
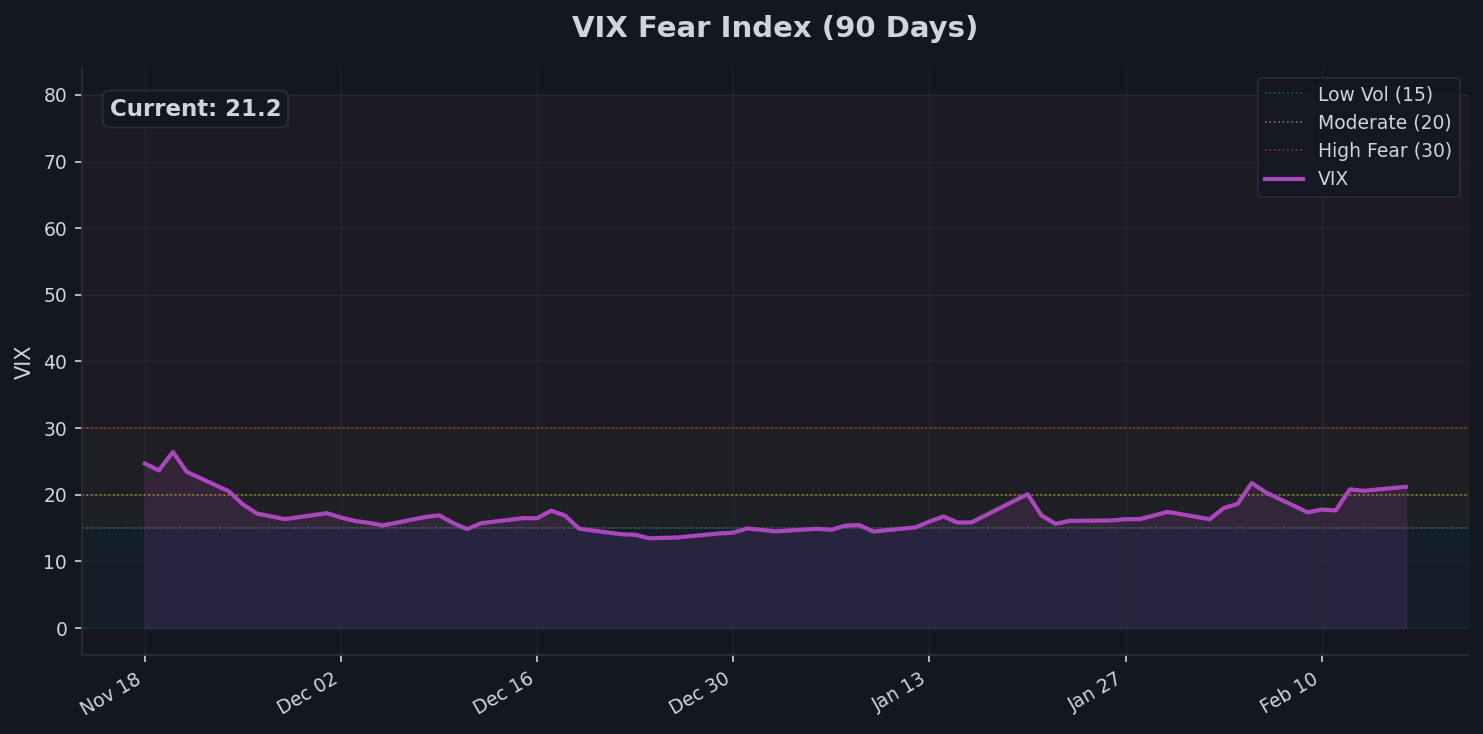
Gold's screaming 'watch out below' at 4988.2, up 19.14% over three months despite a 1.24% weekly dip, while silver's getting whacked, down 8.13% weekly to 75.39 but still up 42.06% quarterly. The dollar index at 97.12 is slumping, off 2.21% monthly, which is juicing commodities but pressuring multinationals. And VIX at 21.2, spiking 22.12% weekly, tells me the crowd's getting jittery—vol's not screaming panic yet, but it's clearing its throat.
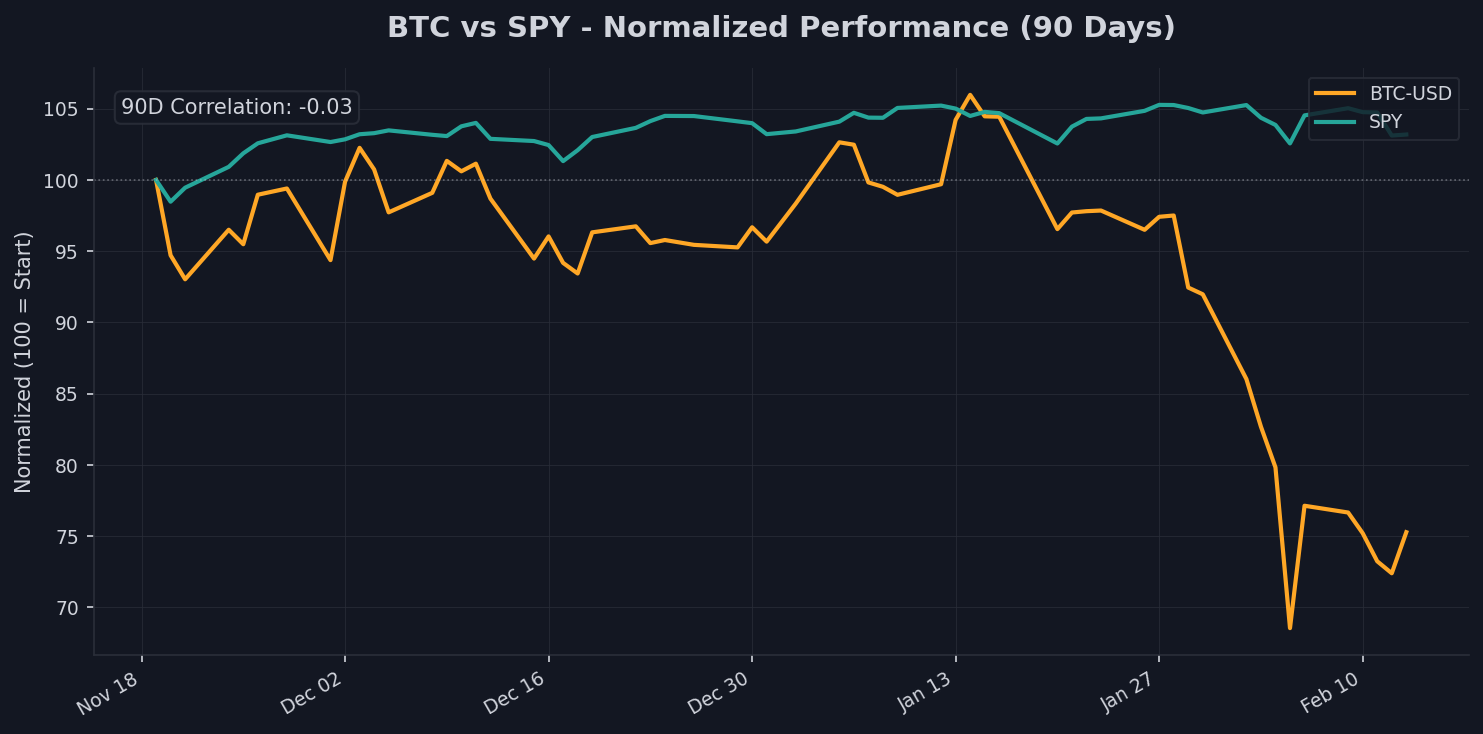
Bitcoin's bucking the trend at 68859.95, up 2.79% weekly even as it's down 21.99% monthly, with a near-zero 90-day correlation to SPY at -0.03. The yield curve's positive at 0.47%, but with short rates steady at 3.59 for the 3-month, it's like the economy's engine is revving unevenly. I've seen this setup before—feels like the market's betting on softer data ahead, and if I were still on the desk, I'd be checking my hedges.
Equities: SPY & QQQ
SPY's at 681.75, just 1.98% off its 52-week high of 695.49, but that weekly drop of 1.28% has it dipping below the SMA20 at 689.15 and SMA50 at 686.87. Momentum's stalling—three-month change is a measly 0.06%, like a race car stuck in traffic. The bond market's screaming caution, and equities are listening; this looks like smart money rotating out of growth into defensives, especially with that flat monthly performance.
QQQ's telling a harsher story at 601.92, down 2.96% over three months and 5.2% from its peak of 634.95. It's underwater on the SMA20 at 616.34 and SMA50 at 618.35, with a 1.27% weekly slide—tech's feeling the pinch from rising vol and falling yields. Back when I was running the book, we'd call this a 'fade the rally' moment; the data suggests more downside if yields keep crumbling, as Nasdaq heavies get hit on multiple fronts.
Overall, both are hugging their 200-day averages—SPY above 646.0, QQQ over 580.24—but the short-term weakness hints at a broader risk-off shift. If vol stays elevated, expect these to test lower supports; I've watched enough melt-ups turn to slumps to know this movie often ends with a sector rotation bloodbath.
Rates & Bonds
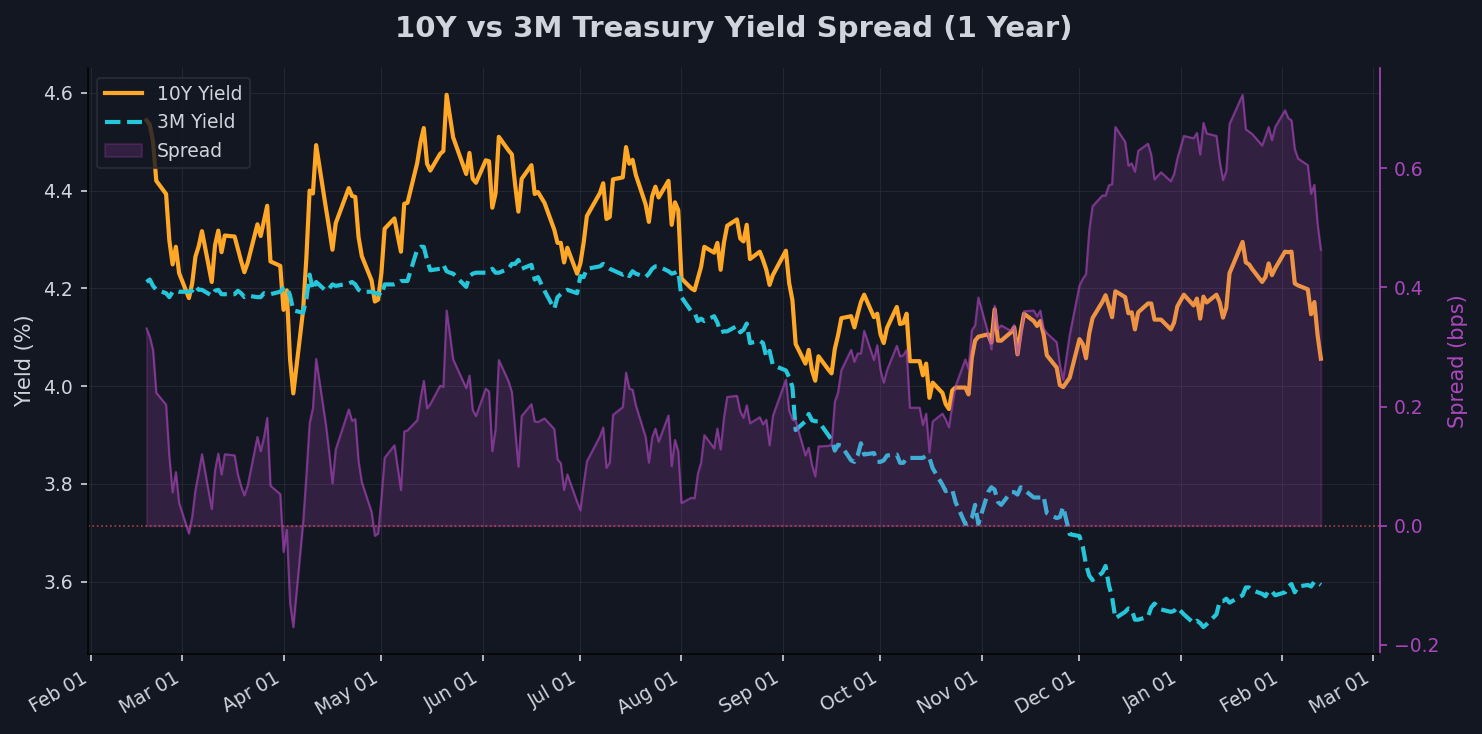
The 10-year yield's at 4.06, down 3.57% weekly and 2.03% monthly, pushing TLT to 89.72 with a 2.49% gain—bonds are acting like a warm blanket in a February chill. The 3-month yield's steady at 3.59, up a tick weekly but down 4.9% quarterly, giving us a positive 10Y-3M spread of 0.47%. That's the curve normalizing, like a twisted ankle finally straightening out, but it's not screaming growth—more like whispering 'maybe no recession tomorrow.'
This setup's bullish for duration; TLT's just 1.08% from its 52-week high of 90.7, trading above its SMA20 at 87.52 and SMA50 at 87.43. For equities, lower yields should be a tailwind, but with vol spiking, it's more of a mixed bag—think of it as the Fed handing out candy while the economy eyes the dentist. If this spread widens further, it could juice risk assets, but right now, it's signaling caution on the growth front.
My old PM used to say yields are the market's heartbeat; this pulse feels erratic, with the 200-day SMA for the 10-year at 4.23 suggesting we're below trend. The curve's positive turn means we're past inversion horrors, but don't pop the champagne—it's like fixing the roof while the storm's still brewing. Watch for any short-rate cuts; that could flip this into a full bull steepener.
Dollar Watch
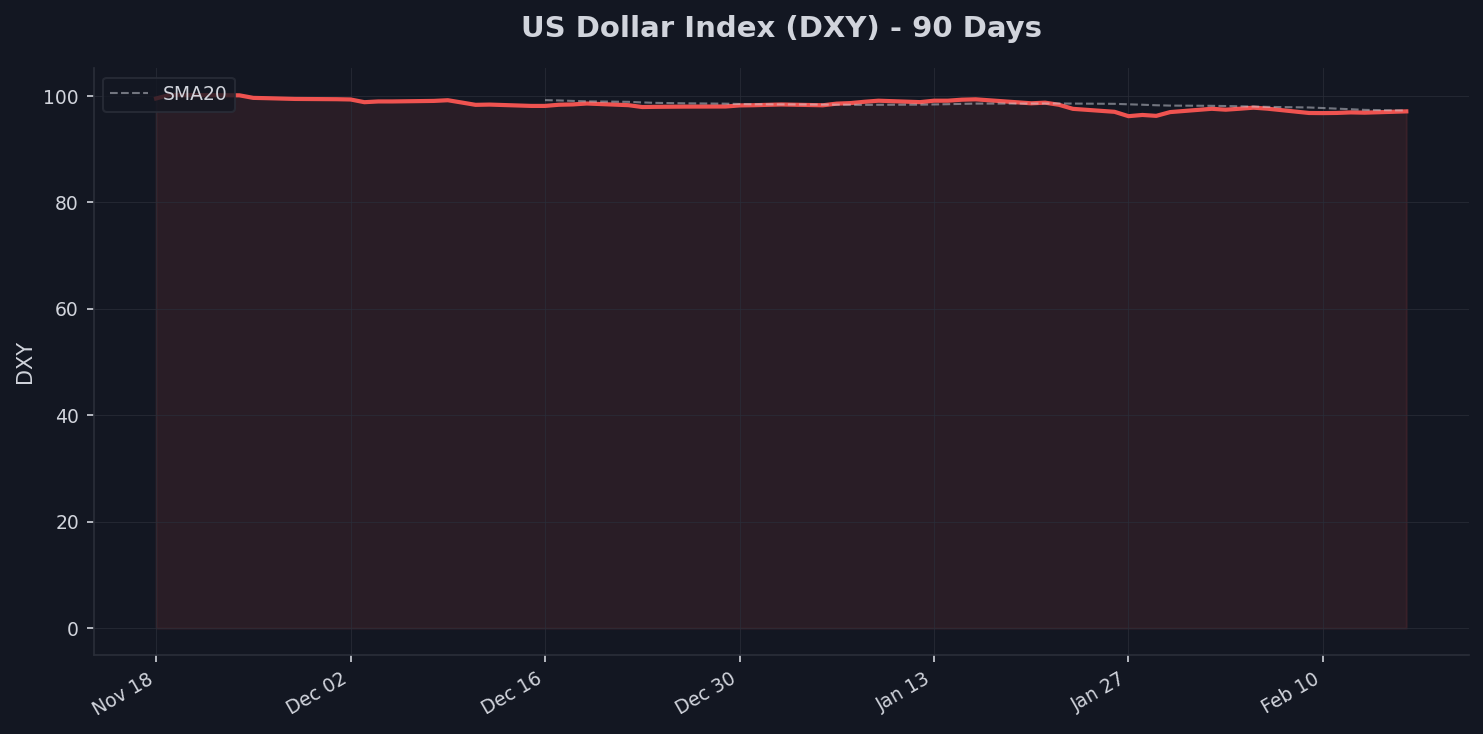
DXY's at 97.12, up 0.31% weekly but down 2.21% monthly and 2.08% quarterly—it's like a heavyweight boxer losing steam mid-fight. Trading just above its 52-week low of 96.22 and below the SMA50 at 98.08, the buck's weakness is real, 9.75% off its high of 107.61. This slide's a boon for commodities but a headache for S&P multinationals, where forex hits could shave earnings like a bad haircut.
Emerging markets are loving it—cheaper dollar means easier debt servicing and hotter exports. But for commodity prices, it's rocket fuel; gold's surge ties right in, as a softer greenback makes everything priced in dollars pop. I've seen this before: dollar weakness often precedes EM rallies, but if it dips below 96, watch for inflation ripples stateside.
The bond bid's amplifying this, with yields falling faster than the buck—think of DXY as gravity easing off, letting assets float higher. If I were positioning today, I'd eye dollar-sensitive trades; the data screams 'fade the strength,' especially with that SMA200 at 98.54 looming above. Bottom line, this isn't king dollar anymore; it's more like a tired regent.
Safe Havens: Gold & Silver
Gold's at 4988.2, down 1.24% weekly but up a whopping 8.06% monthly and 19.14% quarterly—it's like the fire alarm that's been blaring but nobody's evacuating yet. Sitting 6.21% off its high of 5318.4, above the SMA50 at 4623.09 and SMA200 at 3860.41, this screams flight to safety amid equity wobbles and dollar dips. Not full panic, but the smart money's hedging like pros.
Silver's wilder at 75.39, cratering 8.13% weekly and 17.94% monthly yet up 42.06% quarterly—volatile as a caffeine-fueled trader. It's 34.48% off its peak of 115.08, below the SMA20 at 89.07 but above SMA50 at 78.52. The gold/silver ratio at 66.2 sits in that sweet spot—above 60 but below 80—hinting at risk-on undertones mixed with caution, like partying with an eye on the door.
This duo's diverging: gold's steady climb versus silver's swings suggest industrial demand's patchy, but haven flows are dominant. Ratio-wise, 66.2 isn't extreme fear, more like moderate unease; if it drops below 60, we'd see full risk-on. Back on the desk, we'd buy gold dips here—data says it's the hedge du jour as bonds rally and equities falter.
Crypto & Risk Assets
Bitcoin's at 68859.95, up 2.79% weekly despite a brutal 21.99% monthly drop and 20.32% quarterly slide—it's 44.8% off its high of 124752.53, below SMA50 at 83859.57 and SMA200 at 100332.5. Trading like a rogue wave, bucking the equity dip while VIX spikes— that 90-day correlation to SPY at -0.03 says it's decoupling, acting more store-of-value than risk asset right now.
This low correlation's intriguing; usually BTC dances with Nasdaq, but here it's shrugging off QQQ's weakness. Feels like crypto's carving its own path, perhaps sniffing out inflation hedges as gold surges and dollar weakens. If vol keeps rising, though, don't be shocked if it reverts to risk-off mode—I've watched enough cycles to know BTC's 'digital gold' narrative holds until it doesn't.
Bottom line, with that weekly gain amid broader pain, BTC's flashing resilience. Below the SMA20 at 73100.94, it's not out of the woods, but the data suggests it's leaning haven over casino chip. Traders eyeing it as a diversifier? Smart, especially if macro stays choppy.
Fear Gauge: VIX
VIX at 21.2 is in moderate territory, up 22.12% weekly and 33.84% monthly, but still 59.49% off its high of 52.33—above SMA20 at 18.12 and SMA50 at 16.47, signaling we're shifting from complacency to caution. This isn't a full-blown spike like '08, more like the market's coffee finally kicking in after a long nap; positioning's getting defensive as dealers hedge tails.
Three-month change of 6.0% keeps it elevated but not extreme—think of it as the crowd murmuring instead of shouting. It screams 'watch for whipsaws,' especially with equities near highs; my take is this vol regime hints at crowded longs unwinding, potentially capping upside until it settles below 18.
The Bottom Line
Position for a risk-off tilt: watch yields for further drops below 4.0 on the 10-year, as that could pressure equities more. Gold looks like the go-to hedge if vol stays above 20, and keep an eye on DXY dipping under 96 for commodity sparks. This week, incoming data like retail sales could tip the scales—I've seen enough false dawns to bet on caution.