Market Pulse
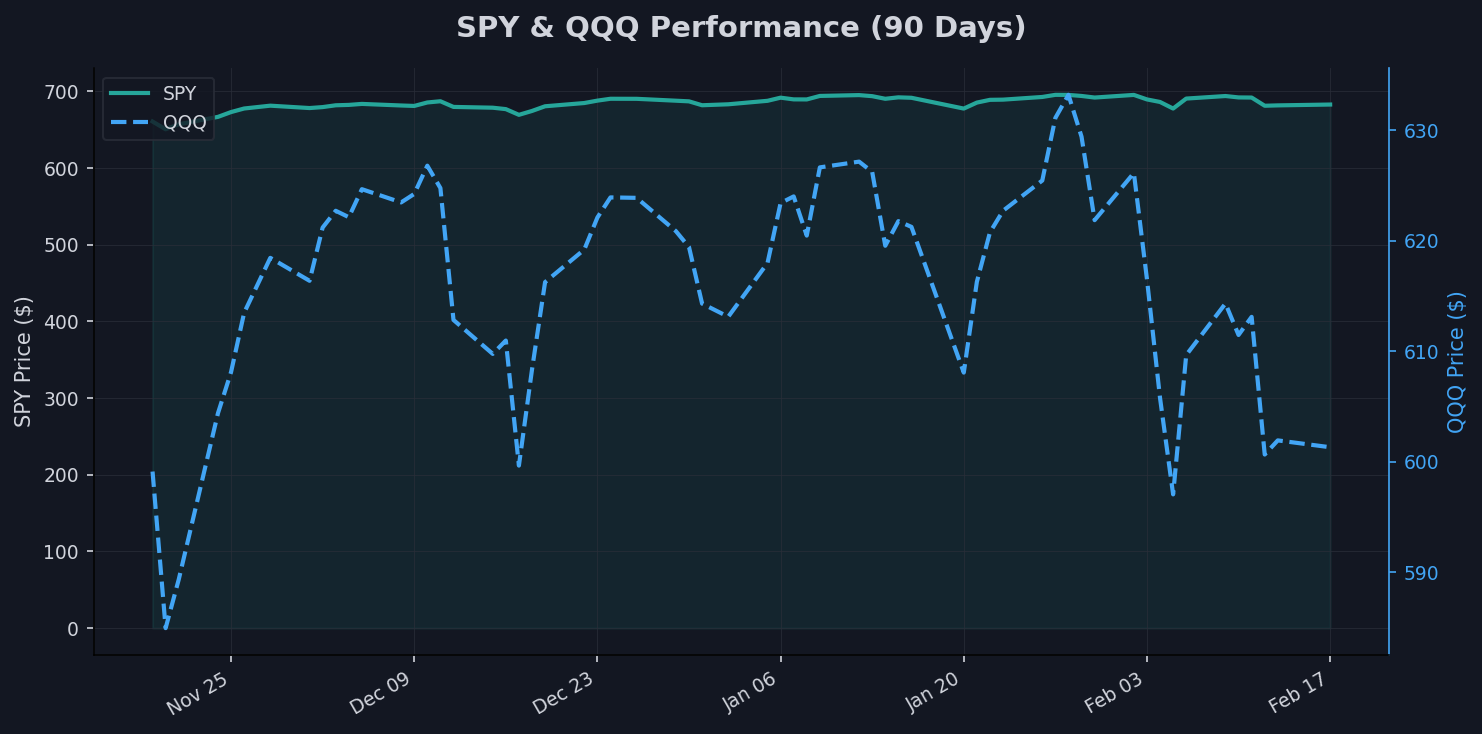
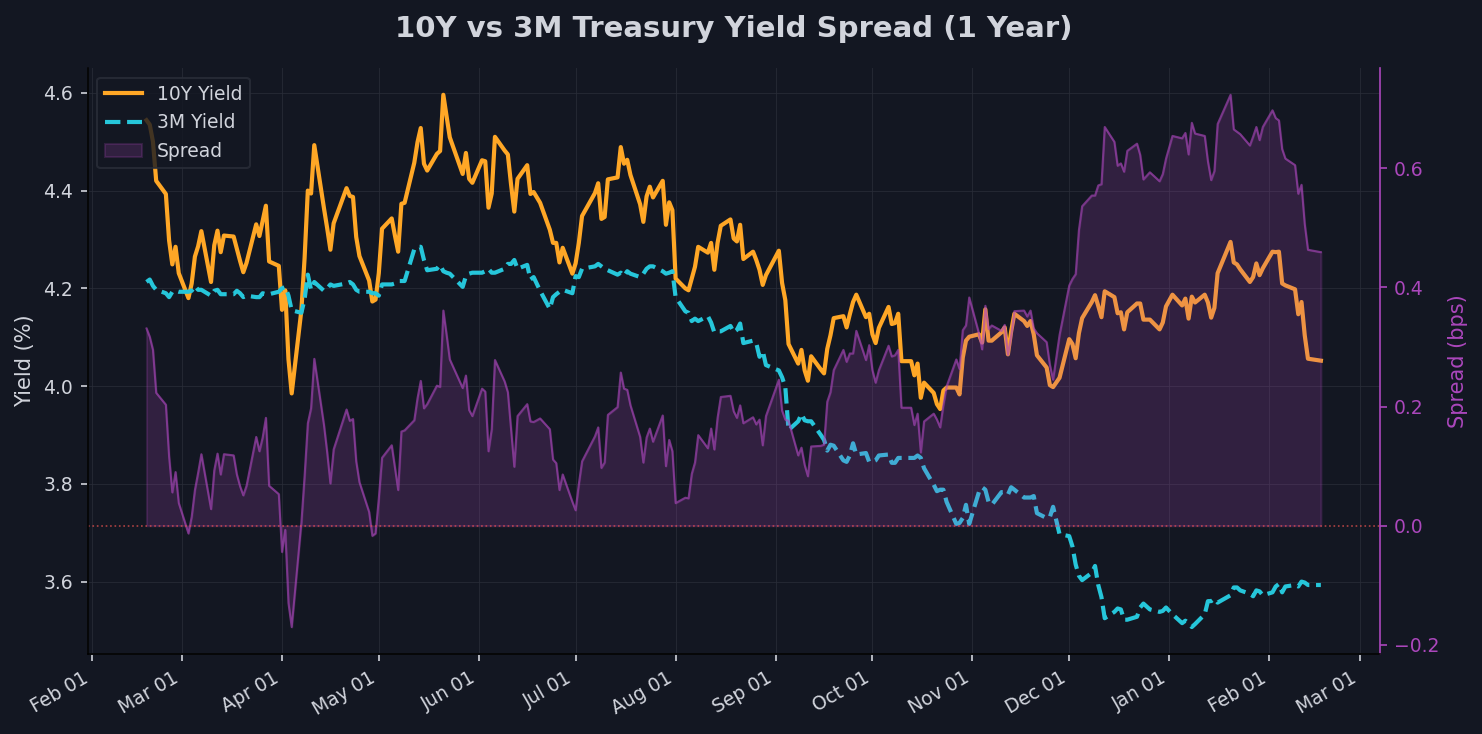
Right now, the macro tape is screaming risk-off vibes with a side of caution. SPY's dipped 1.6% over the week to 682.85, sitting 1.82% off its 52-week high of 695.49, while QQQ's taken a bigger hit at -2.12% weekly to 601.3, a full 5.3% below its peak of 634.95. Yields are crumbling—10Y at 4.05 after a 3.48% weekly drop—pushing TLT up 2.69% to 89.87, flirting with its yearly high.
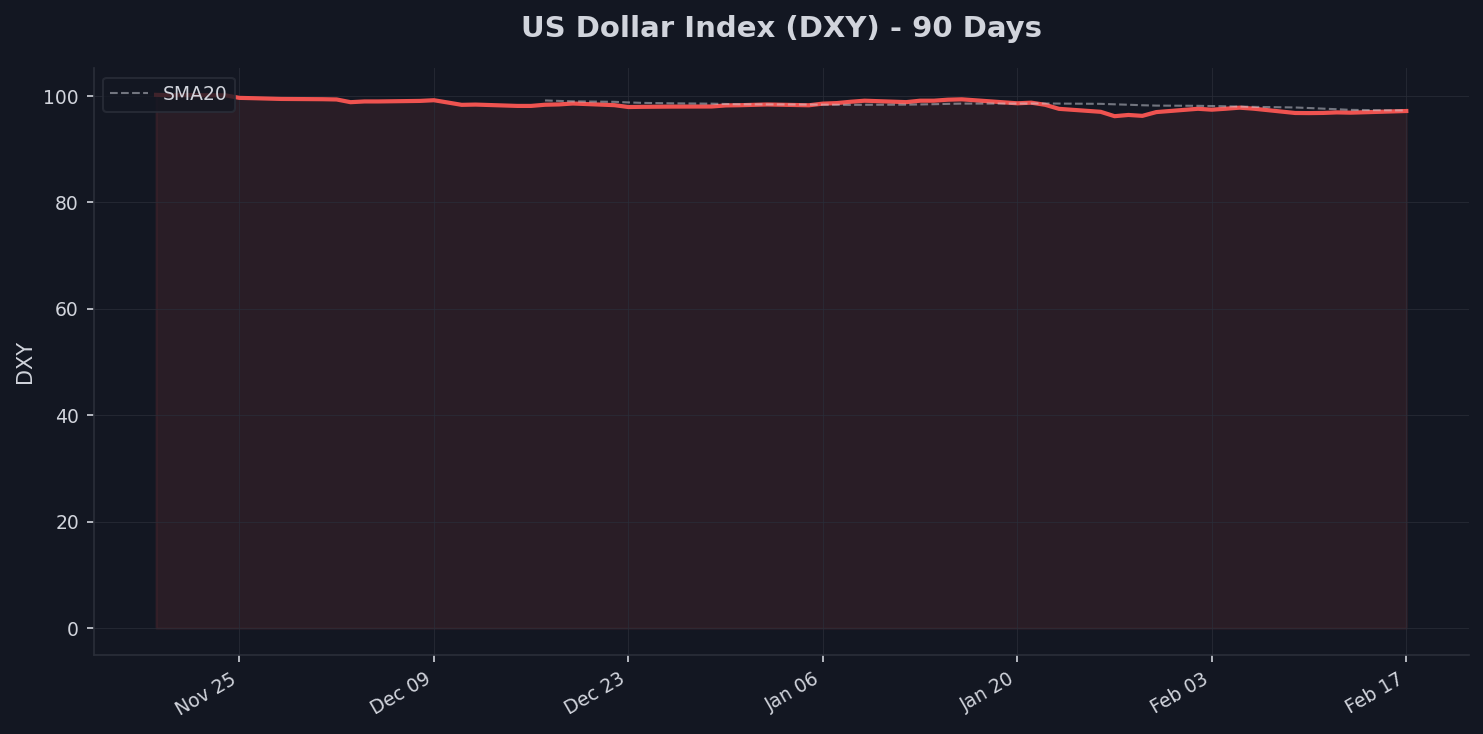
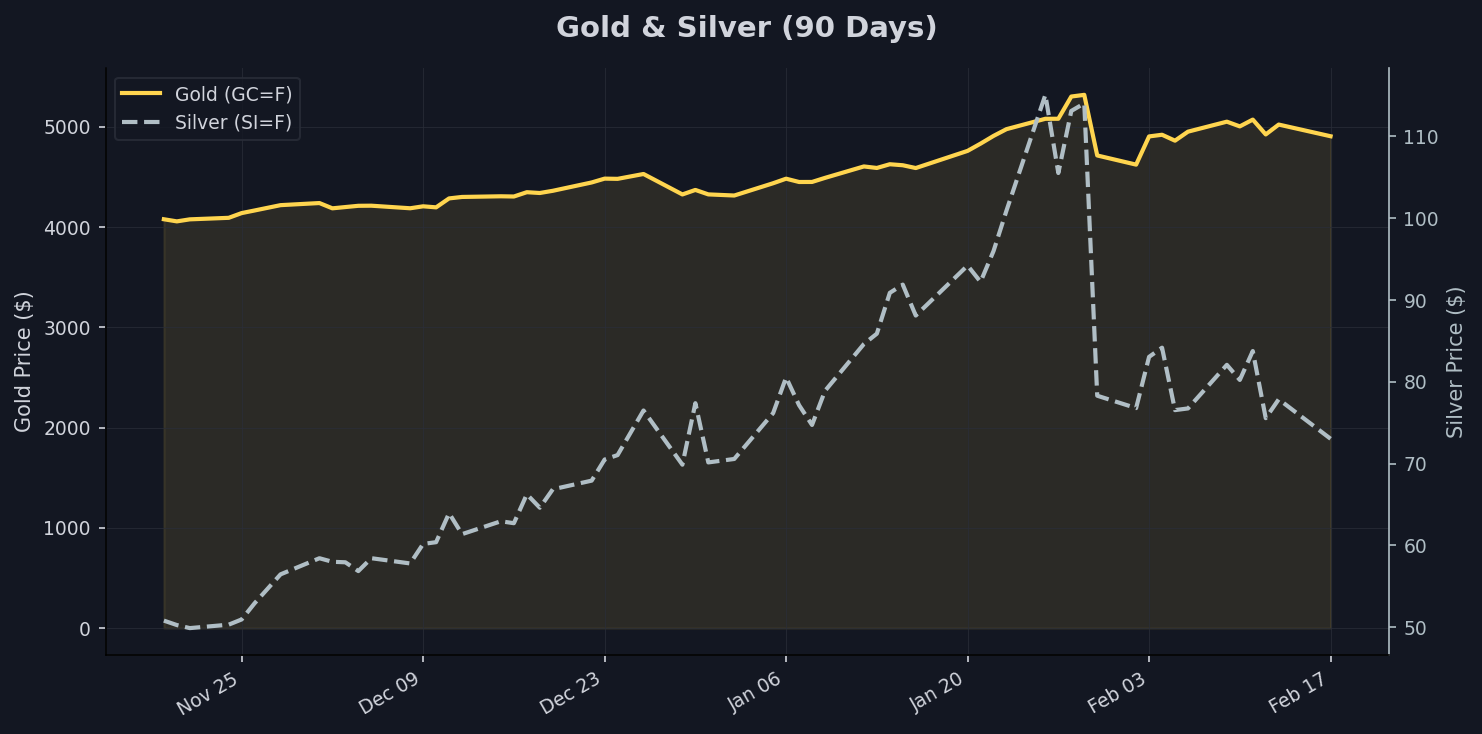
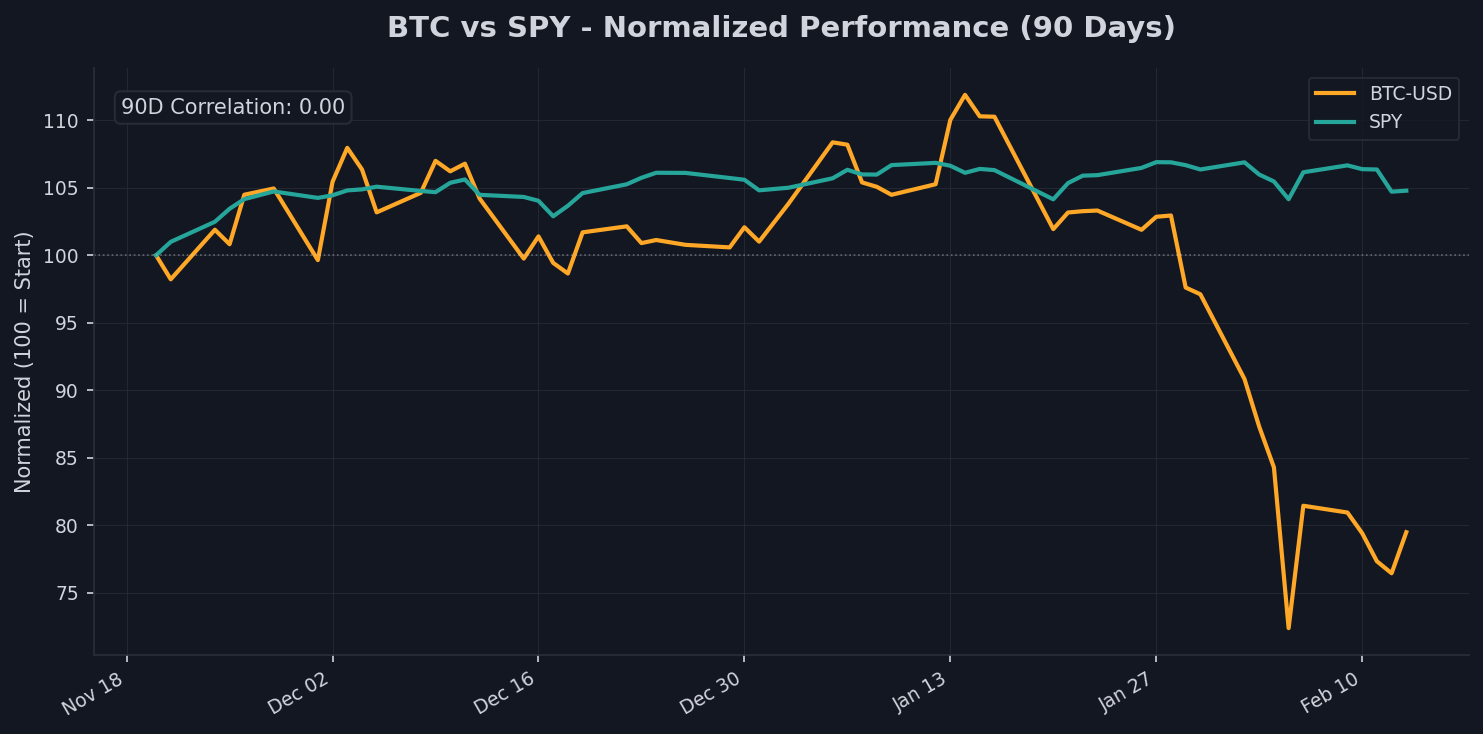
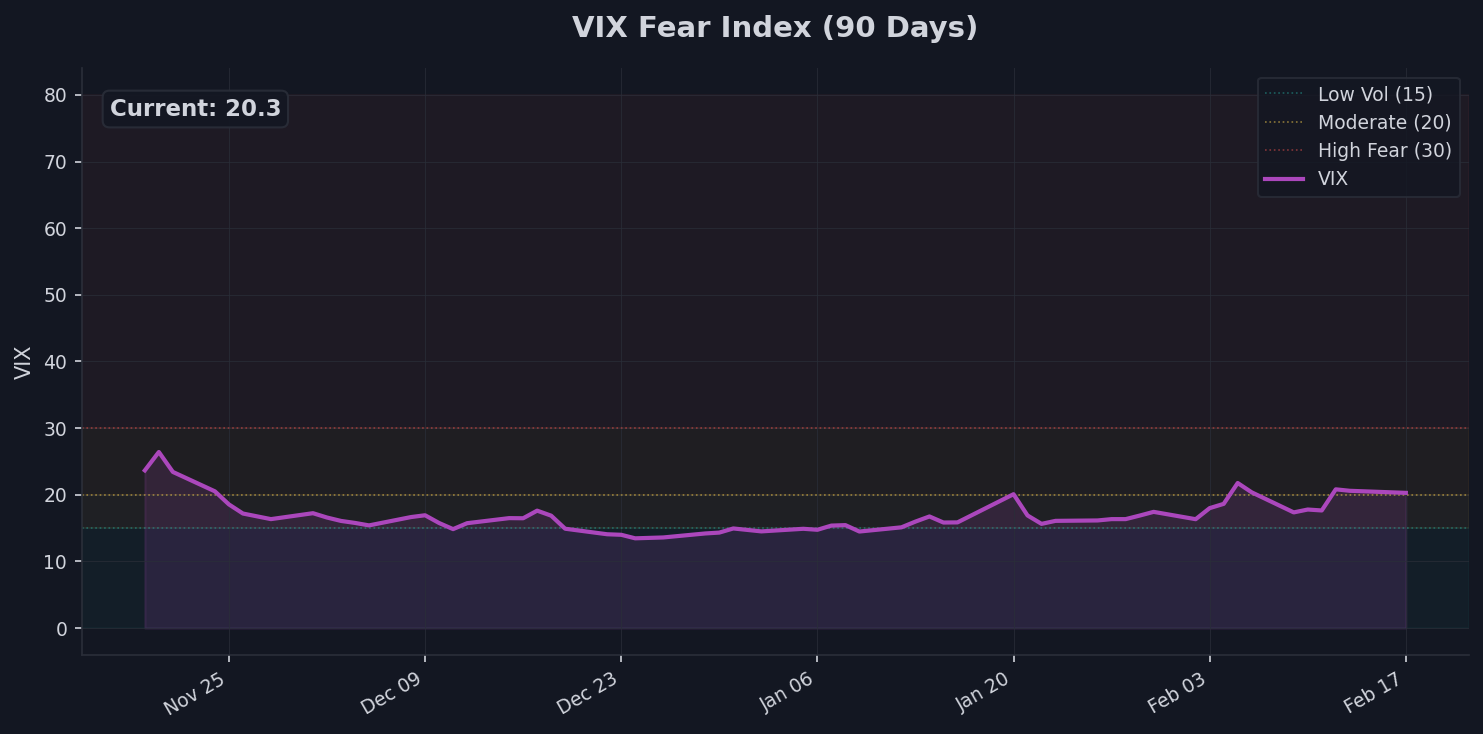
Gold's holding strong at 4905.6 despite a 2.88% weekly pullback, up 6.27% monthly and a whopping 17.17% over three months, while silver's getting crushed at 73.03, down 11.02% weekly and 20.52% monthly. DXY's at 97.19, up 0.38% weekly but down 2.14% monthly, and VIX is spiking to 20.29 with a 16.88% weekly jump, signaling the market's got that post-party jitter. Bitcoin's hanging in at 67156.27, up 1.41% weekly but down 24.63% monthly, fully decoupled from SPY with a 90-day correlation of 0.00.
This setup feels like the market's nursing a mild hangover—equities fading, safe havens perking up, and vol on the rise. Yield curve's normalized to a 0.46% 10Y-3M spread, which could hint at softer landing bets, but that gold/silver ratio at 67.2 says we're not in full panic mode yet. If I skipped the Miami rooftop for this data dive, you know it's got my attention.
Equities: SPY & QQQ
SPY's current at 682.85, down 1.6% weekly and 1.36% monthly, but still up 1.91% over three months—classic consolidation after a run. It's slipped below its SMA20 of 688.71 and SMA50 of 686.89, but holding above the SMA200 at 646.66, which screams 'buy the dip' territory if you're into that momentum play. Distance from the 52-week high of 695.49 is just 1.82%, so this feels like the S&P shaking off some froth, like a quarterback fumbling but still in field goal range.
QQQ's hurting more at 601.3, off 2.12% weekly and 3.29% monthly, with a 1.04% three-month drop—tech's feeling the yield pinch. Below SMA20 (615.34), SMA50 (617.92), and even pressing the SMA200 at 580.87, it's 5.3% from its 634.95 high, suggesting rotation out of growth into value or just plain profit-taking. If this is big money repositioning ahead of rate cuts, I'll bet my Tribeca lease on it—the data's too clean for random noise.
Overall, equities are in a pullback phase, but the longer-term uptrend holds. SPY's resilience versus QQQ's slide points to sector rotation, maybe away from AI hype. Keep an eye on those SMAs; a bounce here could be electric, like the crowd rushing the stage at Ultra.
Rates & Bonds
Yields are in freefall, with the 10Y at 4.05 after a 3.48% weekly drop and 2.6% monthly decline, sitting 11.84% off its 52-week high of 4.6. The 3M yield's flat at 3.59 weekly but down 5.27% over three months, creating a positive 0.46% 10Y-3M spread—curve's normalizing like the market finally agreeing on the plot twist. This inversion unwind could juice equities if it signals recession dodged, but right now it's boosting TLT to 89.87, up 2.69% weekly and just 0.92% from its yearly peak.
Bonds are the quiet winners here, with TLT above SMA20 (87.64), SMA50 (87.46), and SMA200 (86.4), reflecting flight to safety amid equity wobbles. That spread at 0.46% is a green light for economic soft landing bets—think of it as the economy shifting from red light district to green zone. If yields keep dropping, expect more rotation into fixed income, potentially capping stock upside like a bouncer at the club door.
For the economy, this curve steepening suggests easing financial conditions, which could support growth without the Fed overdoing cuts. But watch that 10Y low of 3.95; a break below could ignite a bond rally that starves risk assets. This setup's got me skipping LIV for spreadsheets—it's that intriguing.
Dollar Watch
DXY's at 97.19, up a meager 0.38% weekly but down 2.14% monthly and 2.01% over three months, hovering near its 52-week low of 96.22 and 9.68% off the high of 107.61. It's below SMA20 (97.3), SMA50 (98.08), and SMA200 (98.54), painting a picture of steady dollar weakness—like a fading heavyweight champ. This slide eases pressure on multinational earnings, potentially boosting S&P names with overseas exposure.
For commodities, a softer buck is rocket fuel—gold's up 17.17% over three months despite the dollar dip, and emerging markets could catch a bid as FX headwinds fade. Think of it as the dollar loosening its grip, letting EM currencies breathe and commodity prices pop. If DXY cracks 96, watch for imported inflation vibes that could keep the Fed hawkish.
Overall, this dollar downtrend supports risk assets long-term but might crimp exporters short-term. Multinationals like those in SPY could see EPS tailwinds, while commodity plays get a lift. I'm eyeing that SMA200 breach; if it holds, we're in for more downside fireworks.
Safe Havens: Gold & Silver
Gold's at 4905.6, down 2.88% weekly but up 6.27% monthly and a massive 17.17% over three months, sitting 7.76% off its 5318.4 high yet above SMA50 (4621.44) and SMA200 (3860.0). This resilience screams safe-haven demand amid equity pullbacks, like everyone remembering their insurance policy during a market squall. Below SMA20 (4960.34), it's consolidating, but that three-month surge suggests big money's hedging inflation or geopolitics.
Silver's getting hammered at 73.03, down 11.02% weekly and 20.52% monthly despite a 37.59% three-month pop, a whopping 36.54% from its 115.08 high and below SMA20 (88.95). The gold/silver ratio at 67.2—above 60 but below 80—hints at moderate risk-off, not full fear mode, like the market's worried but not panicking. Silver's industrial side is feeling the growth slowdown, decoupling from gold's pure haven play.
This divergence points to flight to safety in gold, with silver lagging on economic concerns. If the ratio dips below 60, we're talking risk-on rotation; above 80, it's bunker time. The data's filthy here—gold's chart is chef's kiss, and if silver bounces, I'll eat my Patagonia vest.
Crypto & Risk Assets
Bitcoin's at 67156.27, up 1.41% weekly but cratering 24.63% monthly and 23.55% over three months, a brutal 46.17% off its 124752.53 high and well below SMA20 (71998.68), SMA50 (83459.59), and SMA200 (100101.6). The 90-day correlation with SPY at 0.00 means it's fully decoupled—no more tagging along with stocks like a hypebeast sidekick. This suggests BTC's trading more as a store of value amid macro uncertainty, shrugging off equity wobbles.
That said, the monthly plunge aligns with risk asset sell-offs, but the zero correlation screams independent narrative—maybe regulatory noise or just crypto winter vibes. Below those SMAs, it's in bear territory, yet that weekly uptick hints at bottom-fishing. If it's pivoting to haven status like gold, watch for correlation to stay flat; a spike back positive could mean risk-on reload.
Overall, BTC's behaving like digital gold-lite, not a tech proxy anymore. Traders eyeing a rebound should watch that 62702.1 low— a break could be ugly, like a bad NFT drop. This zero-corr setup's got me excited; it's rare air.
Fear Gauge: VIX
VIX is at 20.29, up 16.88% weekly and 28.09% monthly, with a modest 1.45% three-month gain, sitting 61.23% off its 52-week high of 52.33 but above SMA20 (18.08), SMA50 (16.45), and SMA200 (17.41). This puts us in a moderate volatility regime—not complacency low teens, but not panic 30s either—like the market's got butterflies before a big date.
The spike signals positioning unwind, with options demand perking up amid equity dips and yield moves. Above those SMAs, it suggests sustained vol, potentially capping upside until it cools. If VIX pushes 25, expect more hedging; below 15, it's party time again.
The Bottom Line
Position for caution—equities could bounce if yields stabilize, but gold and bonds look like the smart hedges right now. Watch DXY for a break below 96 and VIX for spikes above 25 as key triggers. If the curve keeps steepening, lean into cyclicals, but don't bet the farm yet.