Market Pulse
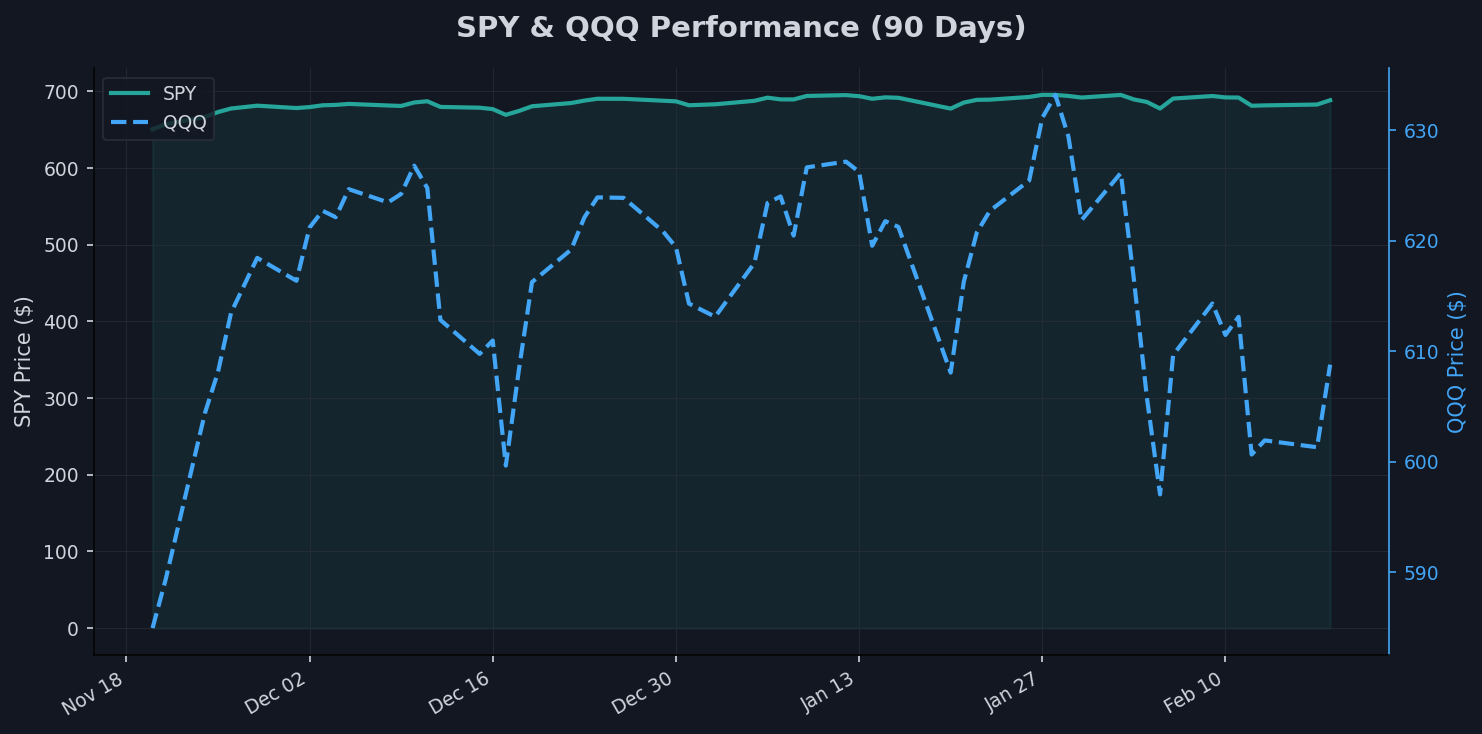
Right now, the tape's telling a story of cautious optimism laced with some real unease. SPY's sitting at 688.51, down 0.52% over the week and flirting just 1% below its 52-week high of 695.49, while QQQ's taken a harder hit at 608.78, off 2.01% monthly and 4.12% from its peak of 634.95. Gold's the star here, ripping to 5019.2 with a 9.39% monthly gain, screaming like a smoke detector in a burning kitchen that something's off in fiat land.
Yields are backing off hard—the 10-year's at 4.08, down 3.55% over the month, pushing TLT up 2.66% to 89.79. The dollar index at 97.4 is slumping, down 2% monthly, which is juicing commodities but pressuring multinationals. Meanwhile, VIX is perking up to 18.78, up 18.41% over the month, hinting traders are starting to hedge their bets without full-blown panic.
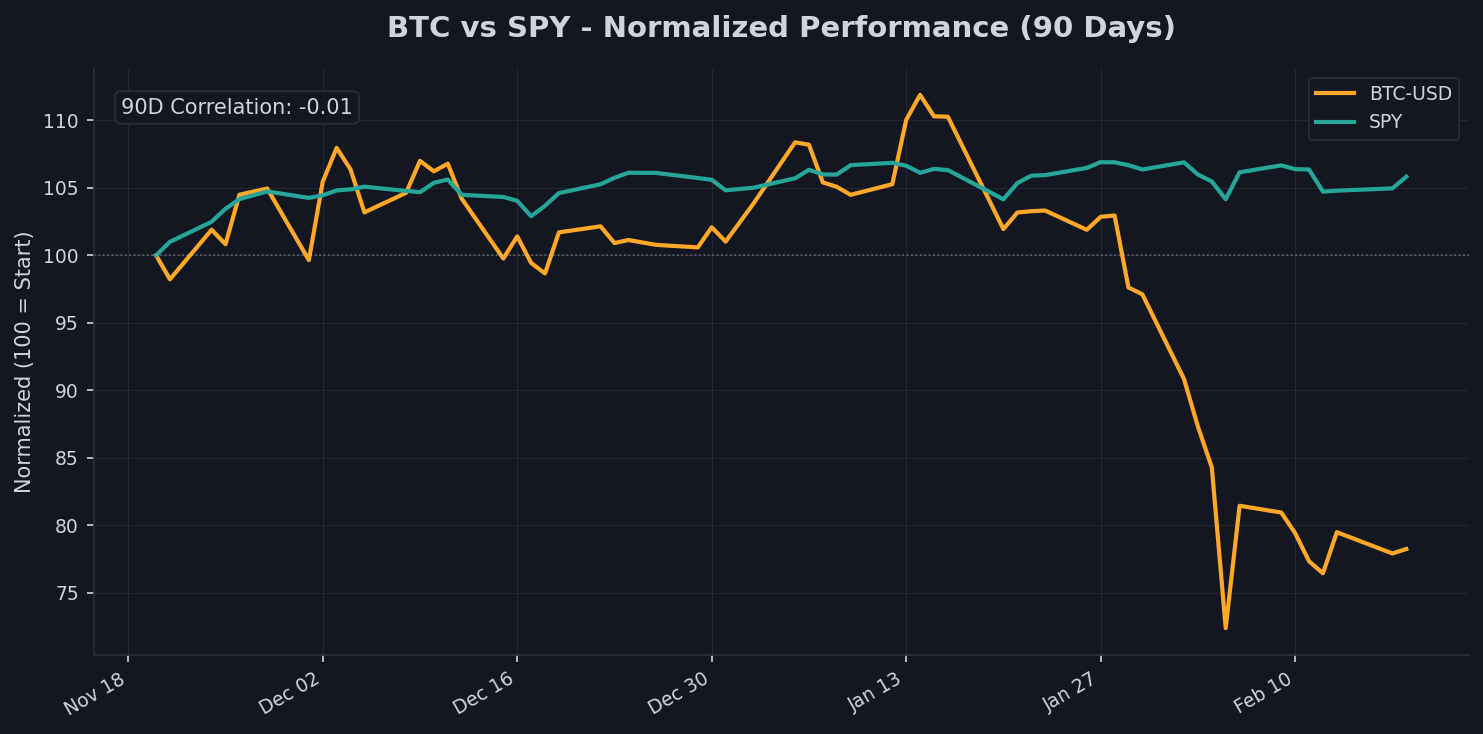
Bitcoin's in the dumps at 67781.99, down 24% monthly and a whopping 45.67% from its high of 124752.53, decoupled from SPY with a 90-day correlation of -0.01. Silver's volatile, down 11.88% monthly to 77.62 but up 53.44% over three months. This mix feels like the market's debating whether we're easing into a soft landing or just delaying the inevitable thud.
Equities: SPY & QQQ
SPY's holding its ground at 688.51, down a mere 0.52% weekly but up 2.77% over three months, hugging its 20-day SMA of 689.25 like a trader clutching his morning coffee during a slow session. It's only 1% off the 52-week high of 695.49, with the 200-day SMA at 647.33 providing a solid floor—looks like broad market resilience, but that flat monthly change of -0.46% suggests the rally's running on fumes. If I were still on the desk, I'd say this is the S&P whispering that earnings might hold up, but don't bet the farm on it without more Fed clarity.
QQQ's looking more winded at 608.78, down 2.01% monthly and 0.44% weekly, sitting below its 20-day SMA of 615.38 and 50-day of 617.65. That 4.12% drop from the 52-week high of 634.95 feels like tech's growth darlings are getting a reality check, especially with only a 0.12% three-month gain. The bond market's yield retreat is helping valuations, but this divergence from SPY reminds me of those desk blow-ups where the Nasdaq leads the way down—watch for any break below the 200-day SMA at 581.52 as a signal to lighten up.
Overall, equities are in this awkward dance, not crashing but not charging either. SPY's momentum above the 200-day line points to dip-buying opportunities, while QQQ's lag screams sector rotation out of frothy tech. I've seen this movie before; it usually ends with a volatility spike if yields keep falling without economic green shoots.
Rates & Bonds
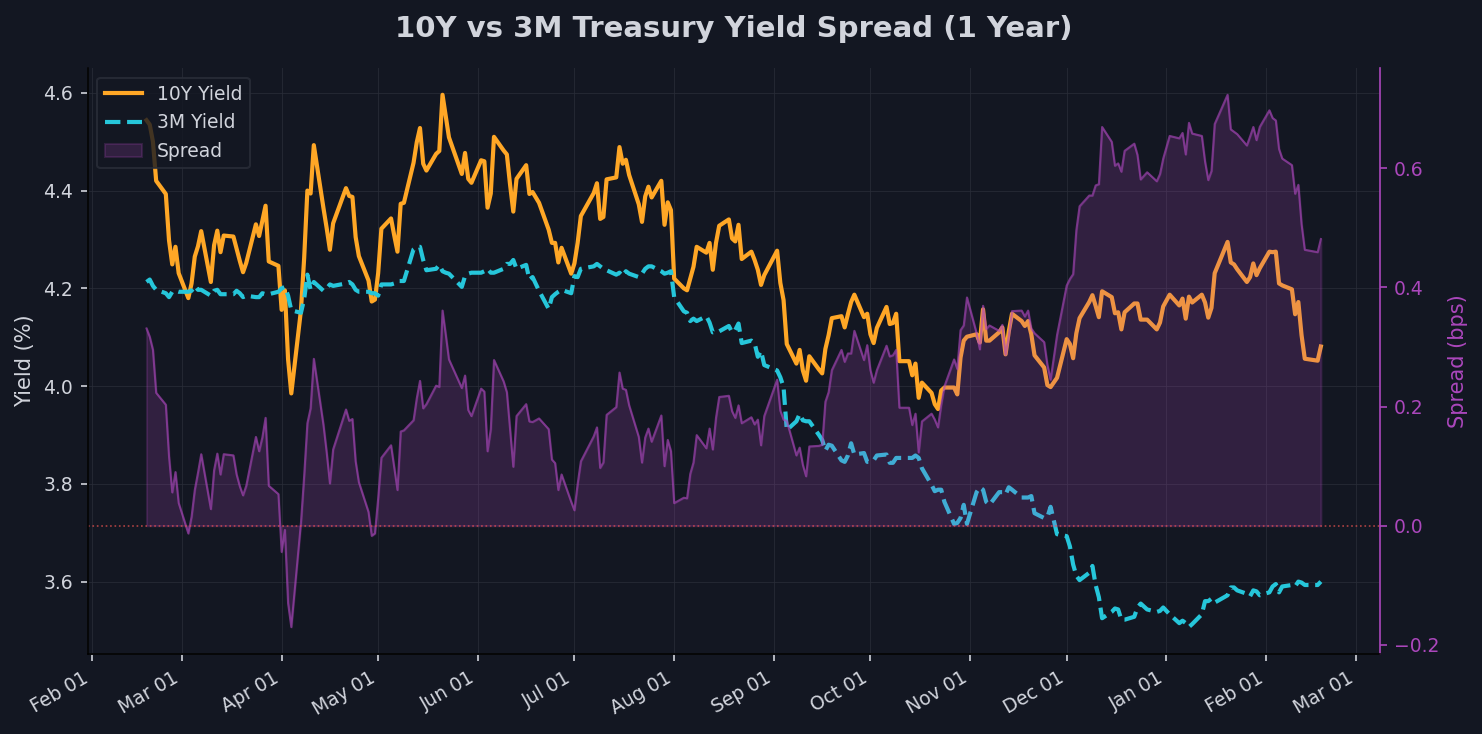
The yield curve's finally looking less like a twisted pretzel, with the 10Y-3M spread at a positive 0.48%—that's normal territory after years of inversion that had everyone bracing for recession. The 10-year yield's dipped to 4.08, down 3.55% monthly and 11.21% from its high of 4.6, while the 3-month's at 3.6, up slightly weekly but down 4.96% over three months. This normalization is like the economy's check engine light flickering off, suggesting the Fed's hikes are digesting without a full stall.
TLT's loving it, up 2.66% monthly to 89.79, just 1% shy of its 52-week high of 90.7, and trading above its 20-day SMA of 87.82 and 50-day of 87.5. Bonds are acting as a shock absorber for equities, pulling yields below the 200-day SMA of 4.22 on the 10-year, which could juice multiples if inflation stays tame. But my old PM used to say curves don't uninvert for free—watch for any steepening beyond this to flag growth bets heating up.
For the economy, this setup whispers soft landing, with lower long-end yields easing borrowing costs without short rates crashing. Equities might catch a bid if the curve keeps normalizing, but if the spread widens too fast, it could mean the market's betting on aggressive cuts—I've traded through enough cycles to know that usually precedes some equity pain before the rebound.
Dollar Watch
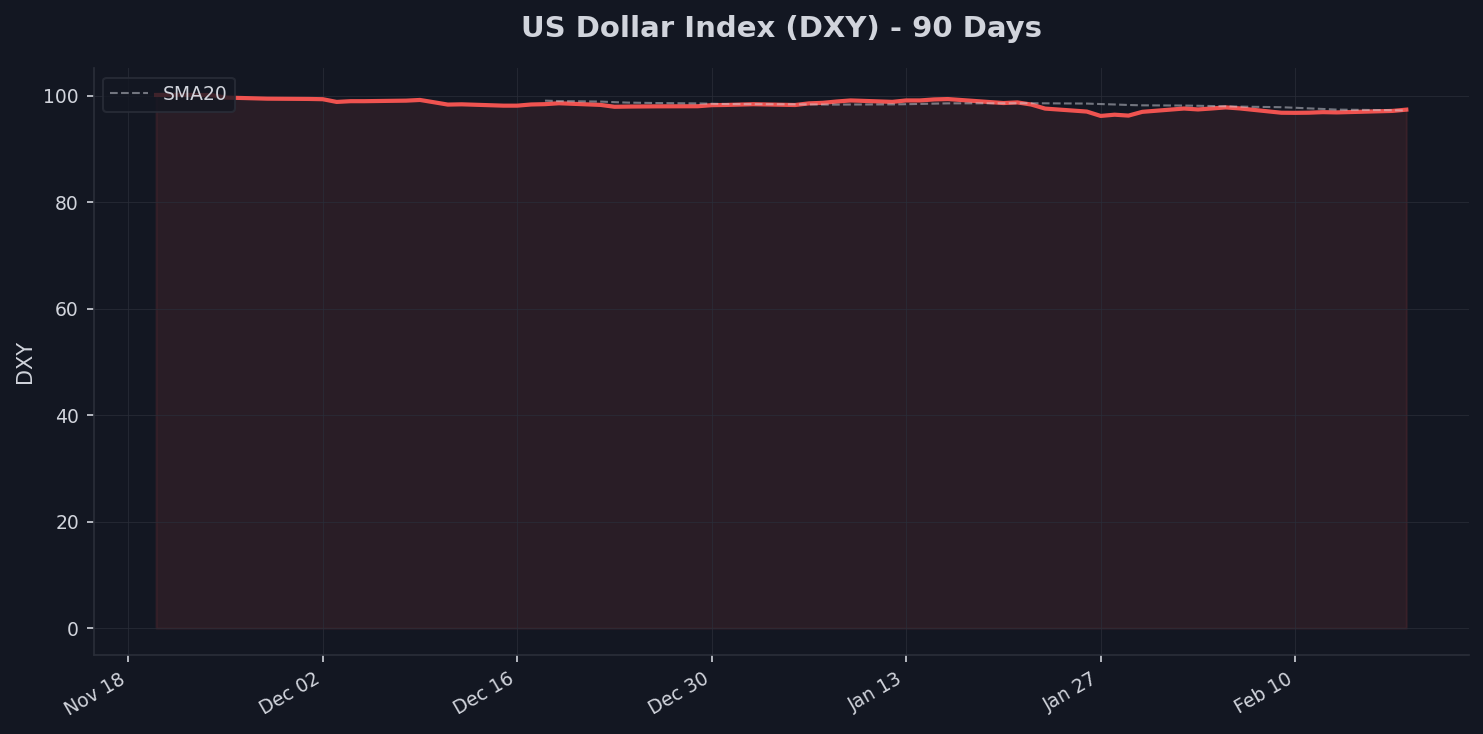
The dollar index at 97.4 is slouching, up 0.62% weekly but down 2% monthly and 1.89% over three months, sitting just above its 52-week low of 96.22 and below the 50-day SMA of 98.05. This weakness is like gravity loosening its grip on global assets, giving multinationals a breather on earnings translations—think exporters sighing in relief as the greenback stops playing bully. But it's only 9.49% off the high of 107.61, so don't call it a rout yet; more like a tactical retreat.
Commodity prices are feeling the love, with gold up 9.39% monthly amid the dollar's dip, and emerging markets likely perking up as cheaper funding flows in. This DXY slide below the 200-day SMA of 98.53 could pressure Fed policy, making rate cuts more appealing if it fuels imported inflation. Back when I was running the book, we'd short dollar pairs on setups like this, betting on carry trades unwinding the other way.
For multinationals, expect some earnings tailwinds, but watch commodity exporters—silver's wild ride down 11.88% monthly despite the dollar's weakness suggests not all boats are rising. Emerging markets might rally, but if DXY finds a floor here, it could snap back and crush those gains. This feels like the dollar's handing the baton to risk assets, but I've seen enough false starts to stay skeptical.
Safe Havens: Gold & Silver
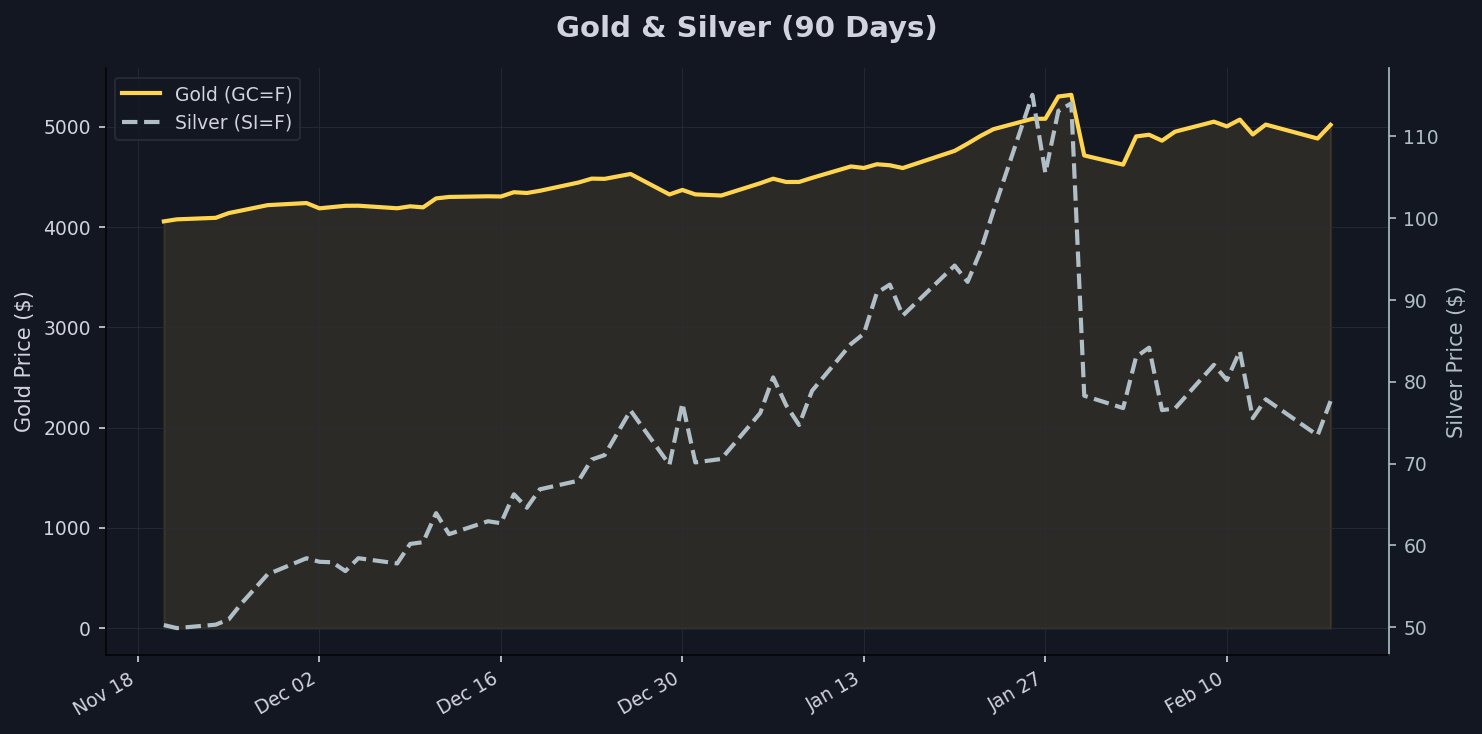
Gold's on a tear at 5019.2, up 9.39% monthly and a massive 22.79% over three months, trading above its 20-day SMA of 4972.18 and way ahead of the 200-day at 3868.82—it's like the yellow metal's a fire alarm blaring while everyone else pretends the house isn't smoking. Only 5.63% off its high of 5318.4, this rally screams flight to safety amid yield drops and dollar weakness, not some risk-on party. If yields keep falling, gold could test new highs, but I've traded through enough bubbles to know it pops when complacency sets in.
Silver's more bipolar, down 11.88% monthly and 3.23% weekly to 77.62, but up an eye-popping 53.44% over three months, dipping below its 20-day SMA of 88.15 yet above the 50-day of 78.9. That 32.55% drop from the high of 115.08 feels like profit-taking after a manic run, but the underlying strength points to industrial demand holding up. The gold/silver ratio at 64.7 is in that sweet spot below 80 but above 60, signaling moderate risk appetite—not extreme fear, but not euphoria either.
This duo's divergence suggests gold's pure haven play, while silver's tied to growth bets. Ratio at 64.7 whispers the market's rotating into risk without abandoning caution—think of it as traders dipping toes in the pool while clutching a life vest. If the ratio drops below 60, we'd see full risk-on; above 80, it's bunker time. I've seen this setup lead to commodity supercycles, but only if the Fed doesn't fumble the landing.
Crypto & Risk Assets
Bitcoin's getting hammered at 67781.99, down 24% monthly and 21.32% over three months, a brutal 45.67% off its 52-week high of 124752.53 and trading below all SMAs like 71176.6 for 20-day and 99879.56 for 200-day. It's decoupled from SPY with a 90-day correlation of -0.01, acting more like a wounded store of value than a risk asset—reminds me of those desk trades where crypto mooned on hype and cratered on reality. This slide feels like the air coming out of the balloon, especially with gold ripping higher as the anti-fiat hedge.
If BTC were still a risk proxy, it'd be tracking QQQ's weakness, but that near-zero correlation says it's charting its own course—maybe regulatory jitters or just fatigue after the boom. Down 1.56% weekly, it's testing the low end near 62702.1, and a break there could spell more pain. Back in my trading days, we'd fade these moves, but this looks like crypto's shedding its speculative skin for something more fundamental.
Overall, BTC's trading as a battered haven, not syncing with equities' mixed tape. If gold keeps surging, bitcoin might catch a bid as digital gold, but with VIX rising, expect more volatility. This uncorrelated slump suggests the market's treating it like a maturing asset class—I've witnessed enough crypto winters to know they end, but not without testing convictions first.
Fear Gauge: VIX
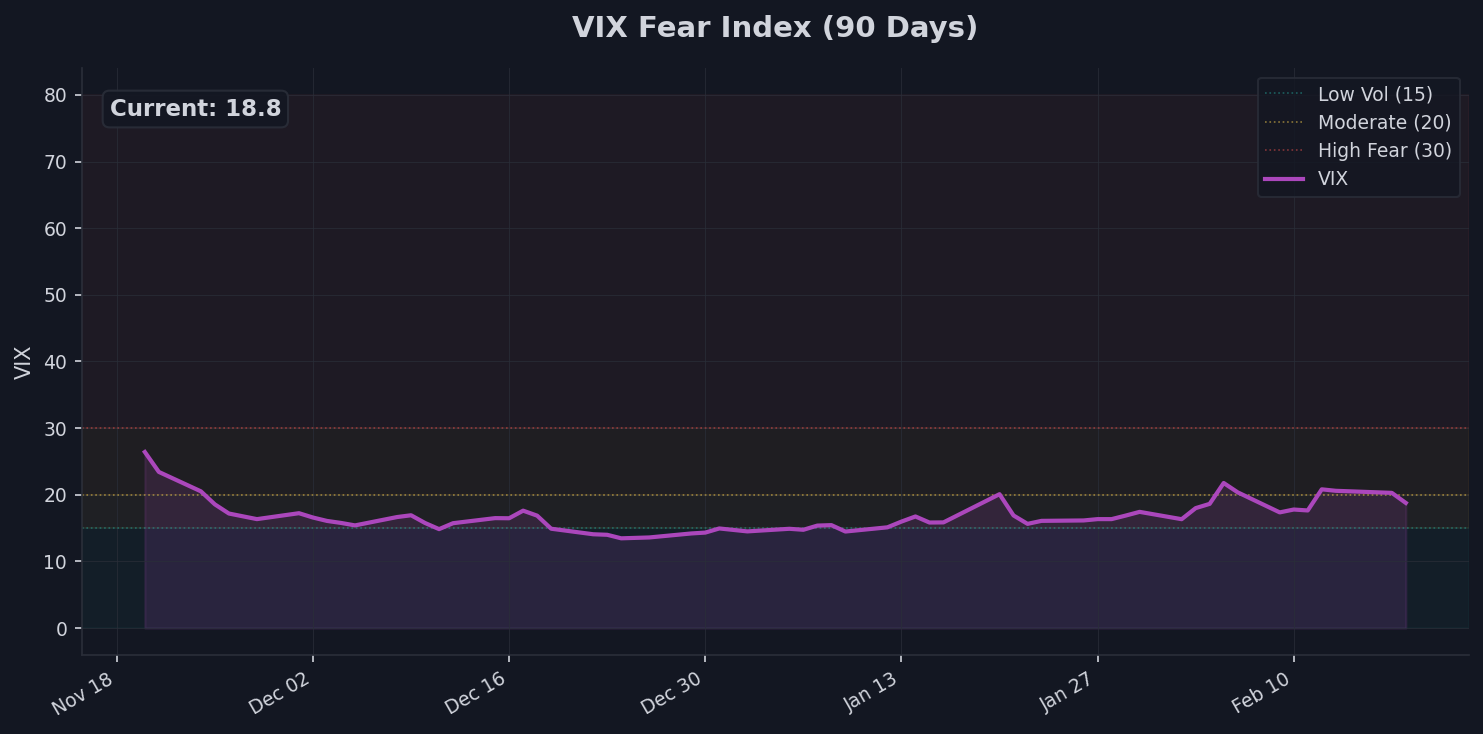
VIX at 18.78 is in moderate territory, up 5.56% weekly and 18.41% monthly but down 5.3% over three months, sitting above its 20-day SMA of 18.01 and 50-day of 16.51. This level's like a low hum in the bar, signaling traders are alert but not scrambling for exits—64.11% off the high of 52.33, it's far from panic, yet the uptick hints at positioning getting defensive amid yield shifts.
What it signals is a market digesting uncertainties without overleveraged blow-ups; above the 200-day SMA of 17.38, but not elevated enough for full hedges. I've seen VIX in this regime precede choppy trading—watch for spikes above 20 as a cue that equities' calm is cracking. It's whispering caution, not screaming sell.
The Bottom Line
Traders should position for a softer dollar and rising gold, eyeing any Fed signals that could accelerate yield declines. Watch the 10-year yield dipping below 4% as a trigger for equity rotation, and keep tabs on VIX breaching 20 for volatility plays. If gold breaks 5200, it's haven mode; otherwise, dip-buy SPY on weakness.