Market Pulse
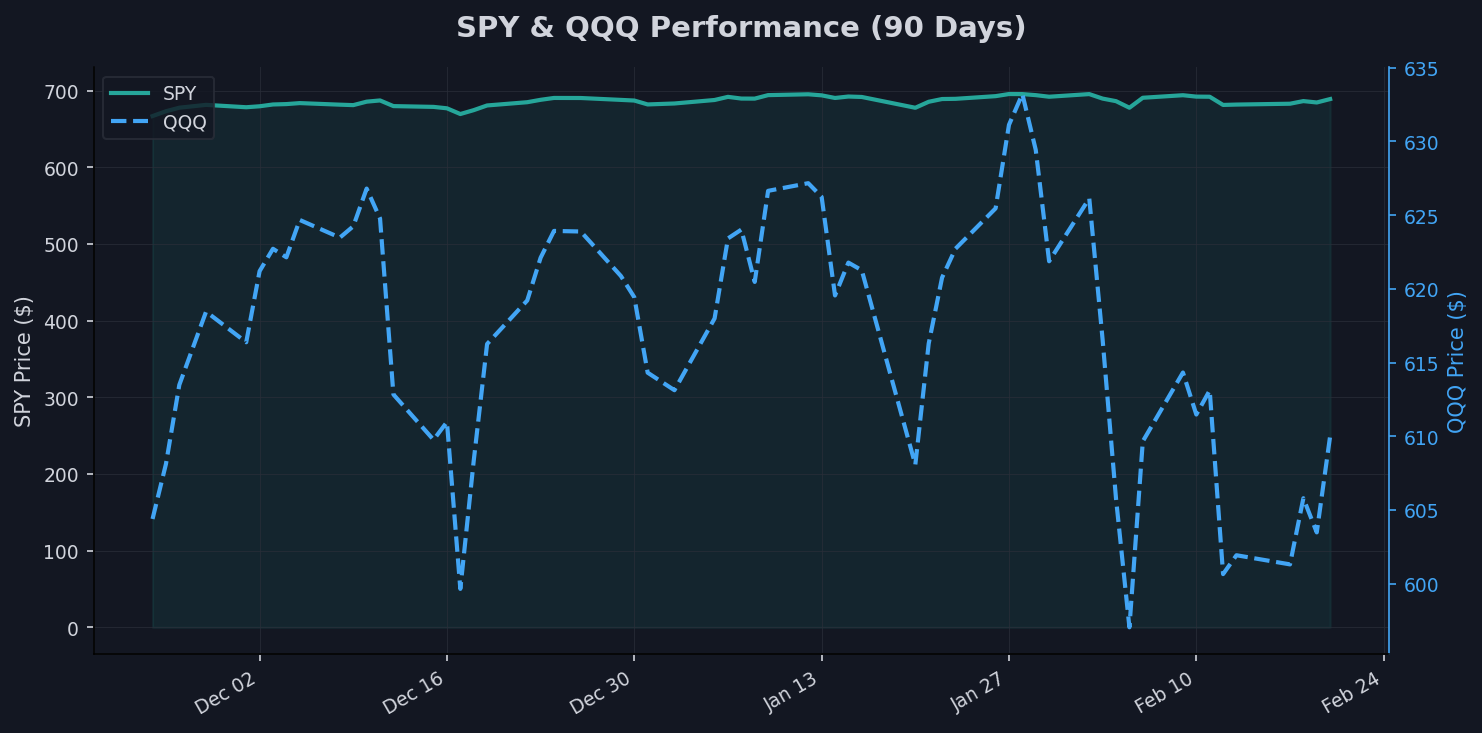
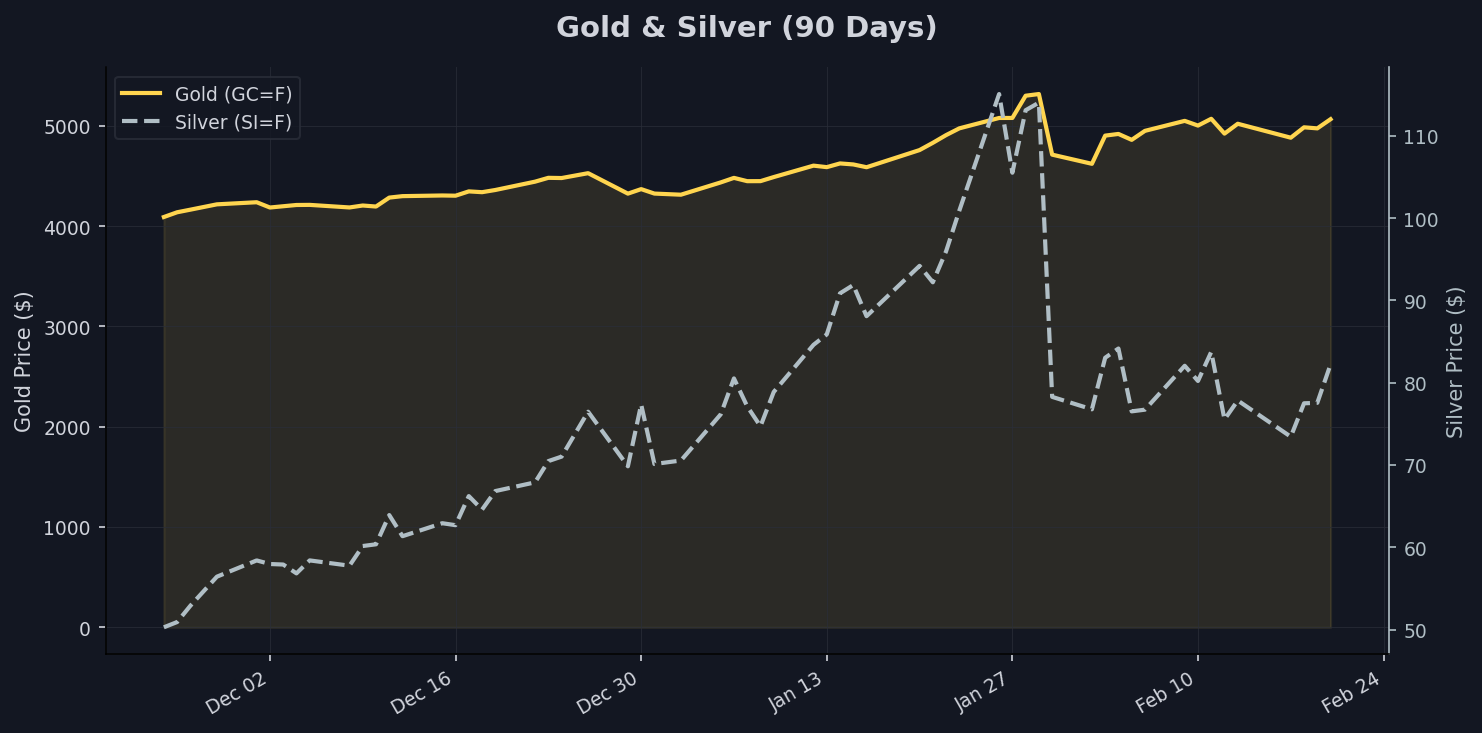
Listen, the tape's got this uneasy calm right now, like a poker table where everyone's bluffing but nobody's folding. SPY's lounging at 688.94, up 1.13% this week and just 0.94% off its 52-week high of 695.49, while QQQ's at 610.01, nursing a 1.02% monthly dip and sitting 3.93% below its peak of 634.95. Gold's the real screamer, futures at 5067.4 after a 2.92% weekly pop and a staggering 24.77% three-month surge, like it's sniffing out inflation ghosts or geopolitical smoke.
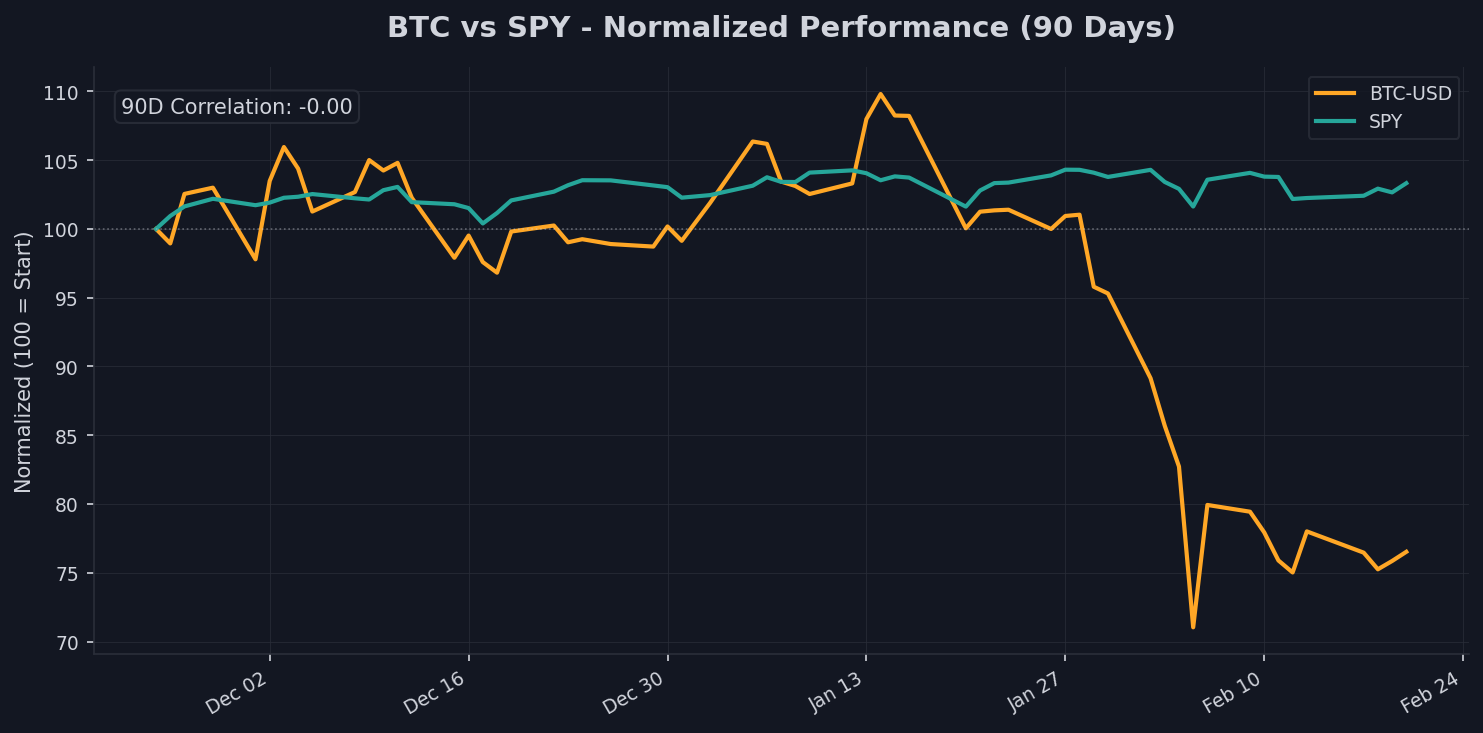
Bonds are catching a bid too, with TLT at 89.2, up 2.56% over the month, as the 10-year yield dips to 4.09, down 3.95% in that span—feels like the bond market's betting on the Fed easing off the brakes. Dollar index at 97.74 is slumping, off 1.03% monthly and 9.17% from its high of 107.61, which is propping up commodities but squeezing exporters. Meanwhile, Bitcoin's in the dumps at 67547.13, down 19.71% monthly and a brutal 45.86% from its 124752.53 peak, decoupled from stocks with that zero 90-day correlation to SPY.
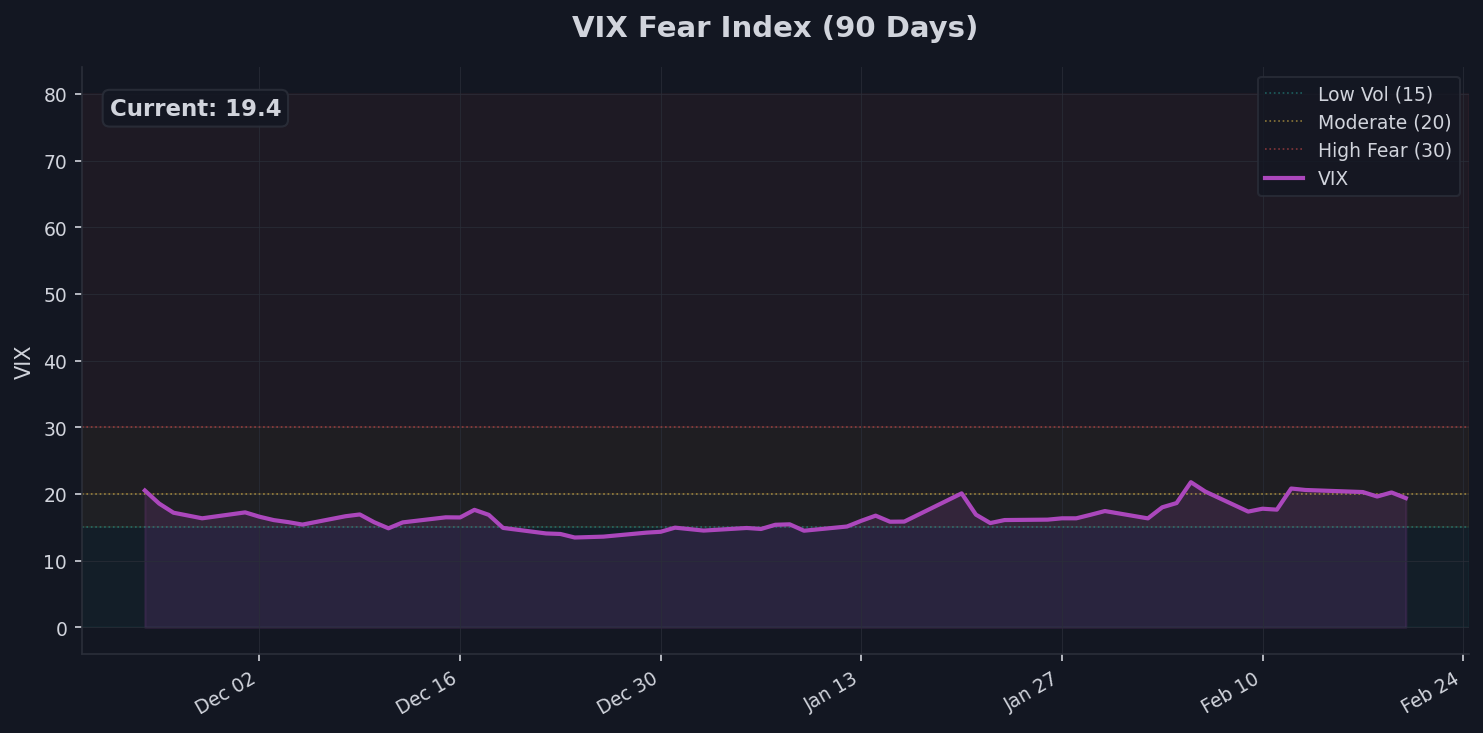
Volatility's simmering at 19.38 on the VIX, down 6.92% weekly but up 14.67% monthly—moderate heat, not panic, suggesting positioning's stretched but not snapping. Silver's wild ride at 82.24, up 8.85% this week yet down 10.82% monthly after a 63% three-month tear, keeps the gold/silver ratio at 61.6, teetering on risk-on vibes. Overall, it's like the market's nursing a hangover from last year's highs, eyeing that positive 0.49% 10Y-3M spread as a tentative all-clear signal.
Equities: SPY & QQQ
SPY's holding court at 688.94, grinding out a 1.13% weekly gain and sitting pretty just 0.94% below its 52-week high of 695.49, with the 20-day SMA at 689.09 basically flatlining above it. That 4.68% three-month creep higher tells me the broad market's digesting gains without much fanfare, like a heavyweight champ pacing himself mid-fight. If I were still on the desk, I'd say this tape's screaming quiet accumulation—momentum's tepid, but the 200-day at 648.59 provides a solid floor, and we're not seeing the froth that precedes a real pullback.
Over in tech land, QQQ at 610.01 is more of a mixed bag, up 1.56% this week but down 1.02% monthly, lagging 3.93% from its 634.95 high. The 50-day SMA at 616.9 is overhead resistance, and that 2.43% three-month uptick feels anemic compared to gold's fireworks—reminds me of those dot-com hangovers where growth stocks get picky about their macro diet. I've seen this movie before: when Qs underperform the S&P by this margin, it's often the canary signaling earnings pressure from a softening dollar or rising yields, but with the 200-day at 582.71 well below, dips could be buyable if vol stays contained.
Bottom line on equities, the divergence between SPY's resilience and QQQ's wobble suggests rotation into value over growth, maybe betting on that yield curve normalization juicing cyclicals. No outright euphoria here—these levels are hugging moving averages like a drunk to a lamppost, stable but not sprinting. Traders eyeing breaks above those 52-week highs might find fuel in lower yields, but watch for any VIX spike to expose the cracks.
Rates & Bonds
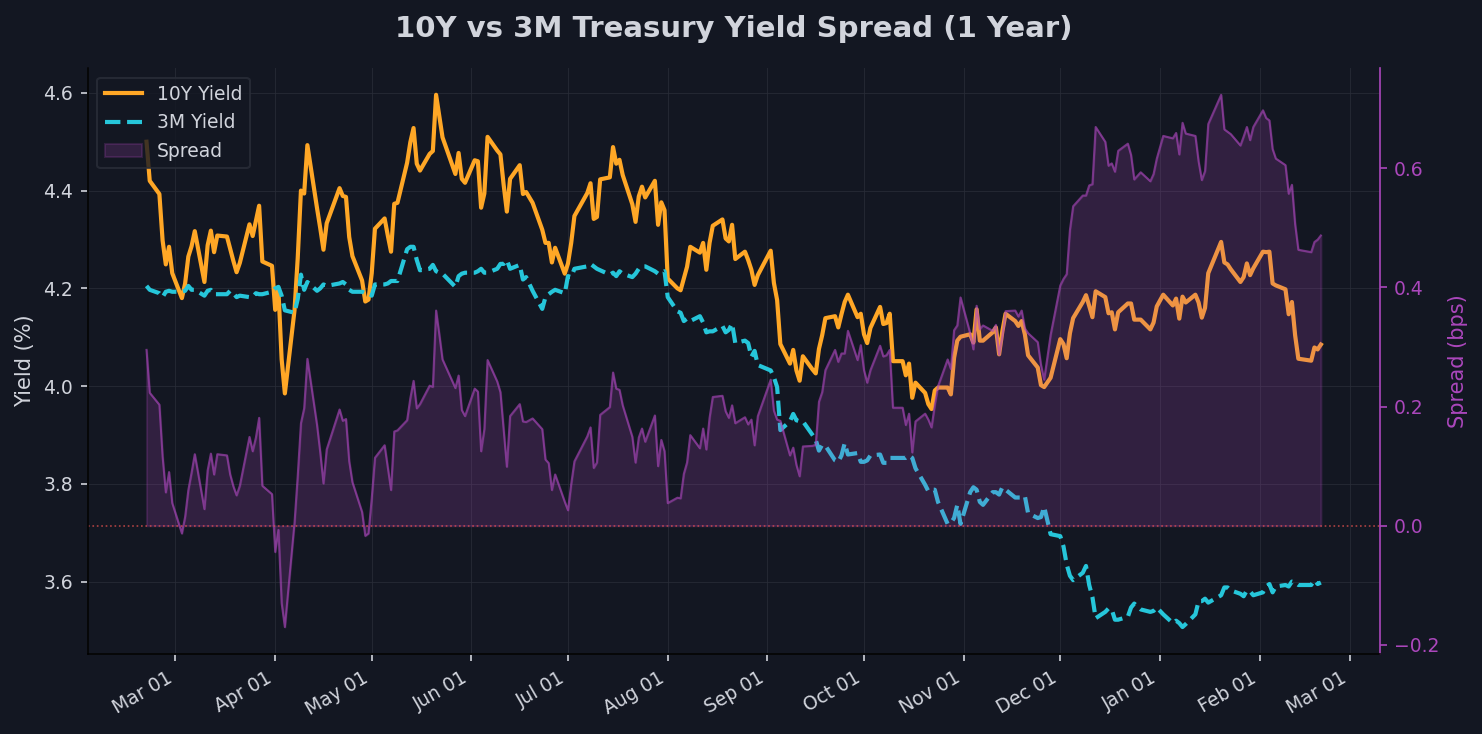
Yields are exhaling, with the 10-year at 4.09 after a 3.95% monthly drop from levels that peaked at 4.6 last year, now 11.12% off that high and below its 20-day SMA of 4.18. TLT's responding in kind at 89.2, up 2.56% over the month and just 1.65% shy of its 90.7 peak, like bonds are the market's comfort food amid equity jitters. The three-month yield's stuck at 3.6, flat weekly but down 4.61% over three months, painting a picture of front-end stability while the back end eases—classic setup for curve steepening.
That 10Y-3M spread at a positive 0.49% is the real tell: we're out of inversion territory, which historically unclogs the economic pipes like thawing a frozen engine. Back when I was running the book, a normalizing curve like this often presaged equity relief rallies, as it hints at recession odds dialing back—think of it as the market's EKG flattening from arrhythmia. But with the 200-day SMA on the 10-year at 4.22 still above current levels, any rebound in yields could slam bonds and ripple into stocks.
For the economy, this setup screams soft landing hopes, but don't get cocky; that 1.29% three-month nudge in TLT suggests haven demand lingers, maybe from inflation whispers or global wobbles. Equities could ride the wave if the Fed plays along, but if spreads widen further, it might juice inflation trades over growth—I've watched curves flip moods faster than a trader's P&L on NFP day.
Dollar Watch
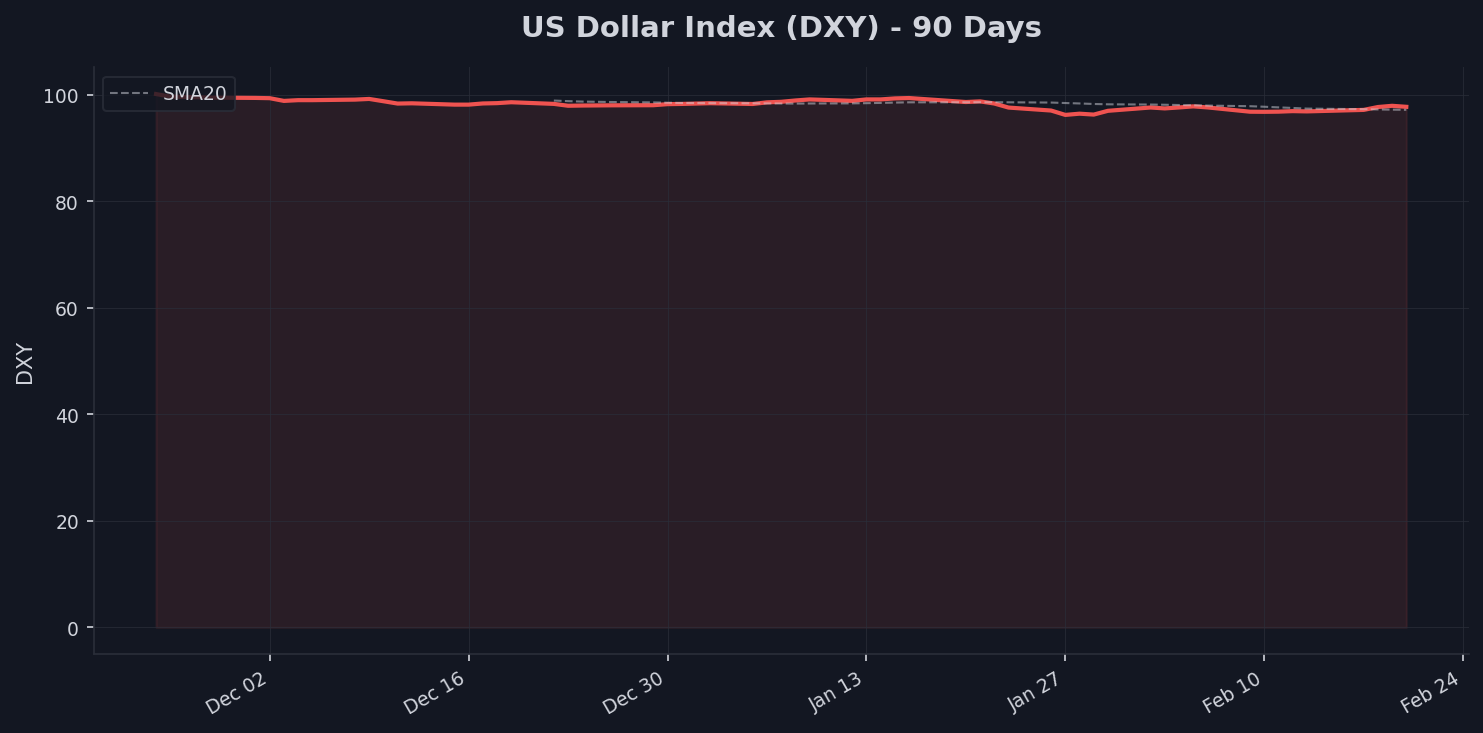
DXY's slouching at 97.74, up 0.84% this week but down 1.03% monthly and a hefty 9.17% from its 107.61 high, hovering above the 20-day SMA of 97.17 but below the 50-day at 98.01. It's like the greenback's lost its swagger, weighed down by yield dips and maybe some Fed dovishness—reminds me of gravity finally catching a high-flying kite. This weakness is a tailwind for multinational earnings, easing the translation hit for S&P names with overseas revenue, potentially adding a few basis points to EPS growth.
On commodities, a softer dollar at these levels is like fertilizer for prices—gold's 24.77% three-month rip and silver's 63% surge owe a nod to this, as imports get cheaper and EM demand perks up. Emerging markets catch a breather too, with less debt pressure and room for their currencies to rally—think Brazil or India exporters grinning at the inflows. But my old PM used to say a dollar below 98 often signals risk-on rotations, yet here it's paired with gold strength, so maybe it's more about hedging than outright optimism.
Watch for DXY breaks below 96.22, its 52-week low; that could unleash commodity beasts but hammer US exporters. Impacts cascade: weaker buck juices oil and metals, but if it tanks too fast, inflation alarms blare, forcing yields higher. I've seen dollar slides turn into routs, and with the 200-day at 98.51 overhead, any rebound might cap the party—traders, keep an eye on ECB or BOJ moves for the next shove.
Safe Havens: Gold & Silver
Gold's on a tear at 5067.4, up 2.92% weekly and 4.88% monthly, with a jaw-dropping 24.77% three-month gain, sitting 4.72% off its 5318.4 high but well above the 20-day SMA of 4985.68. It's behaving like a smoke detector in a smoldering room—surging not from pure fear but maybe inflation bets or dollar weakness, drawing in the smart money as a portfolio airbag. The 200-day at 3885.26 is ancient history now, underscoring this as a structural uptrend, not a flash in the pan.
Silver's the wild sibling at 82.24, exploding 8.85% this week after a 63% three-month moonshot, though it's down 10.82% monthly and a steep 28.54% from its 115.08 peak—volatility city, with the 50-day SMA at 79.77 providing recent support. That gold/silver ratio at 61.6, just above the 60 threshold for risk-on, suggests we're dipping toes into bullish waters without full immersion; below 60 screams greed, above 80 fear, so this feels like cautious optimism, maybe industrial demand kicking in for silver amid green energy hype.
Overall, safe havens are flashing mixed signals: gold's rally smacks of flight-to-quality with a twist of speculation, while silver's swings hint at risk rotation. If this is pure haven buying, equities should wince, but paired with a positive yield curve, it might be inflation insurance—I've watched metals lead macro turns before, and this tape says watch for gold breaking 5318.4 to confirm the bull or a silver catch-up to flip the ratio lower.
Crypto & Risk Assets
Bitcoin's in the penalty box at 67547.13, down 1.8% weekly and a punishing 19.71% monthly, with a 23.33% three-month slide leaving it 45.86% off its 124752.53 high—feels like the crypto king got dethroned, trading below its 20-day SMA of 69696.51 and way under the 50-day at 82191.53. That zero 90-day correlation to SPY is telling: BTC's decoupling, not marching in lockstep with risk assets like it did in the bull runs, more like a standalone bet gone sour amid regulatory fog or macro headwinds.
Is it a risk asset or store of value? Right now, it's leaning the former but failing at it—those drawdowns mirror tech wrecks, yet without the equity bounce, suggesting whales are cashing out or hedging elsewhere, maybe into gold's shine. The 200-day at 99398.85 towers above, acting like a magnet for any recovery, but with vol in crypto land making VIX look tame, it's trading as digital dynamite rather than steady haven. Back on the desk, we'd call this a capitulation phase, where weak hands fold and the asset resets.
Watch that correlation: if it flips positive again, BTC could ride equity tails, but staying at -0.00 hints at idiosyncratic pain, perhaps from ETF outflows or mining costs. For now, it's not screaming store of value with gold ripping higher—more like a speculative orphan, and traders should eye breaks above 82191.53 for signs of life or further drops to 62702.1 to bail.
Fear Gauge: VIX
VIX at 19.38 is in moderate territory, down 6.92% weekly but up 14.67% monthly, sitting above its 20-day SMA of 18.41 and signaling stretched positioning without outright chaos—think of it as the market's pulse quickening during a tense negotiation, not a full sprint. That 21.51% three-month drop from highs of 52.33 puts us far from panic mode, but 62.97% off that peak means complacency could be creeping in, especially with equities near records.
This regime whispers opportunistic vol selling, as 19-ish levels often precede mean-reversion dips, but I've seen enough fakeouts to know a spike to 25 could unwind crowded trades fast. It signals the tape's digesting macro without major unwind risks yet—watch for VIX below 16.68 (50-day) to confirm calm or above 20 to flag hedging demand building.
The Bottom Line
Position for a tentative risk-on thaw with gold as your wildcard hedge—equities look buyable on dips if yields stay soft, but dollar weakness could ignite commodities further. Watch this week's Fed minutes for yield cues and any gold breakout above 5318.4 to gauge inflation bets. If VIX creeps over 20, tighten stops on longs.