Market Pulse
Right now, the tape's painting a picture of cautious optimism laced with some old-school jitters. SPY's grinding out a slim 0.26% weekly gain but sits 1.63% off its 52-week high of 695.49, while QQQ's up 0.68% over the week yet nursing a 3.8% monthly drop, 4.64% below its peak at 634.95. Gold's the star, slamming into a fresh 52-week high at 5349.4 with a 2.78% weekly pop and a monster 28.43% three-month surge, like a smoke signal warning of hidden fires in the global economy.
Yields are exhaling after a tense run— the 10-year's at 4.04, down 4.33% over the month, and the 3-month's steady at 3.58. The dollar index is flexing a 0.93% weekly climb to 98.61, but it's still 7.63% shy of its yearly top at 106.75. Volatility's perking up with VIX at 21.57, a 27.78% monthly spike, reminding me of those desk days when the room got quiet before a storm.
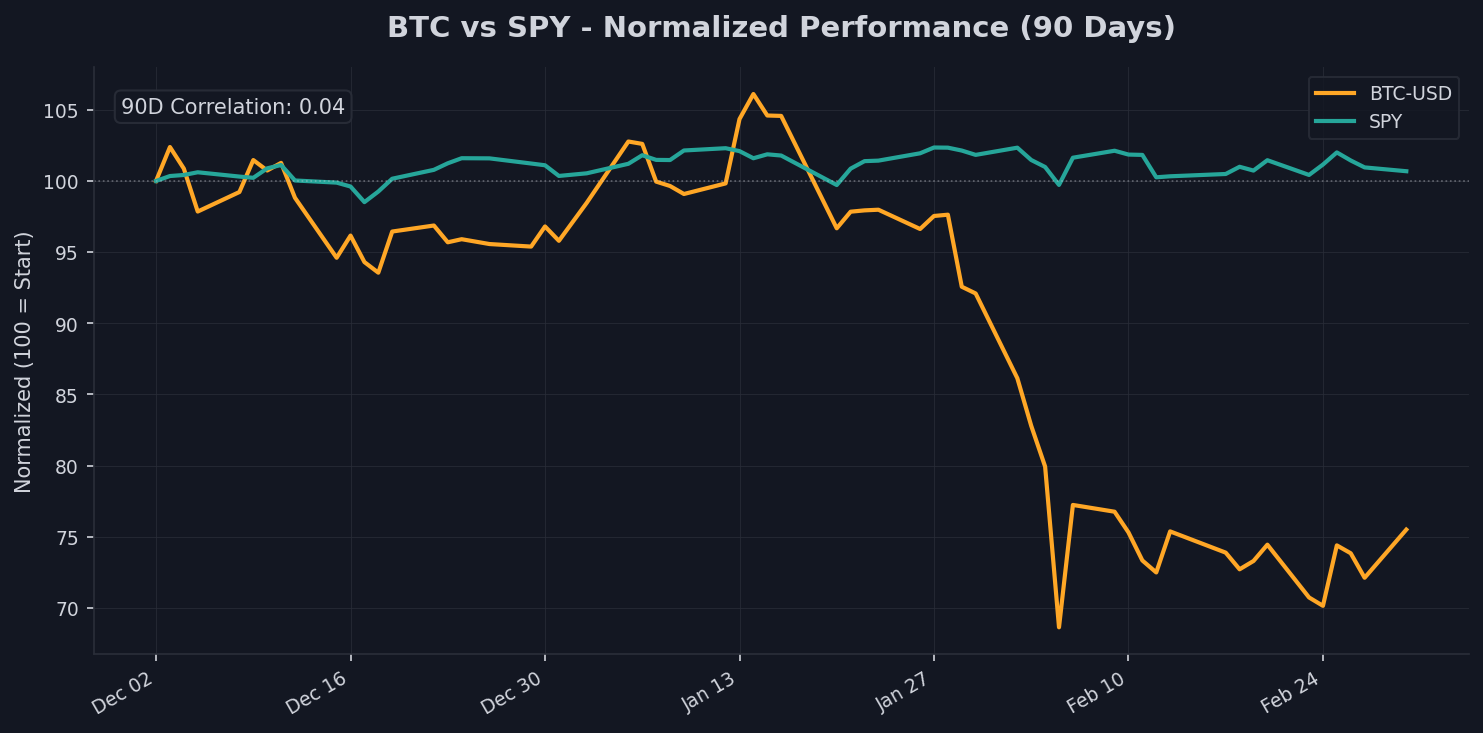
Bitcoin's hanging back at 68971.86, down 1.64% monthly and a bruising 20.85% over three months, decoupled from stocks with a scant 0.04 90-day correlation. Silver's volatile ride shows a 4.21% weekly bounce but a 20.93% monthly plunge, yet it's up 70.39% in three months. The yield curve's back to a positive 0.46% spread, like the engine finally turning over after months of sputtering.
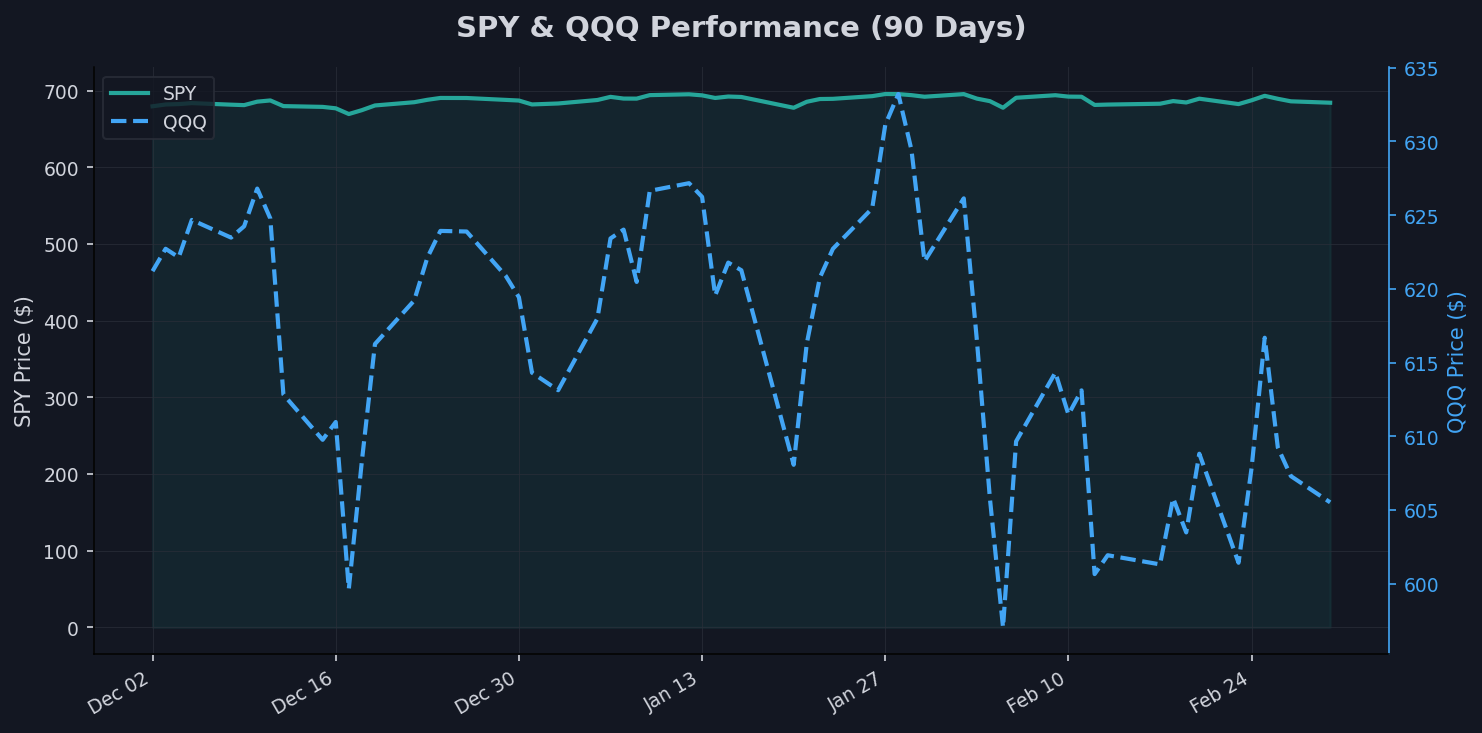
Equities: SPY & QQQ
SPY's treading water like a trader waiting for the next Fed whisper—current at 684.17, it's eked out a 0.26% weekly nudge but slipped 1.42% over the month, sitting 1.63% below that 695.49 high. The 20-day SMA at 687.29 and 50-day at 687.81 are hugging close, but it's well above the 200-day at 652.25, suggesting the long-term trend's intact even if momentum's as flat as last night's whiskey. If I were still on the desk, I'd say this looks like consolidation before a potential break, but the 0.96% three-month gain feels more like marking time than charging ahead.
Over in tech-heavy QQQ, it's a similar story with a twist—up 0.68% weekly to 605.51, but down 3.8% monthly and 1.3% over three months, 4.64% off the 634.95 summit. That 20-day SMA at 608.2 and 50-day at 615.65 are sloping down gently, while the 200-day at 586.18 provides a floor, like a safety net under a tightrope walker. The data screams fatigue in growth names; I've seen this movie where AI hype fades and reality bites, usually ending with a rotation to value or a broader pullback.
Both are dancing around their short-term averages, hinting at indecision. SPY's distance from highs is tighter than QQQ's, pointing to broader market resilience versus tech's vulnerability. Keep an eye on whether they reclaim those SMAs or test the 200-day lines— that's where the real tells emerge.
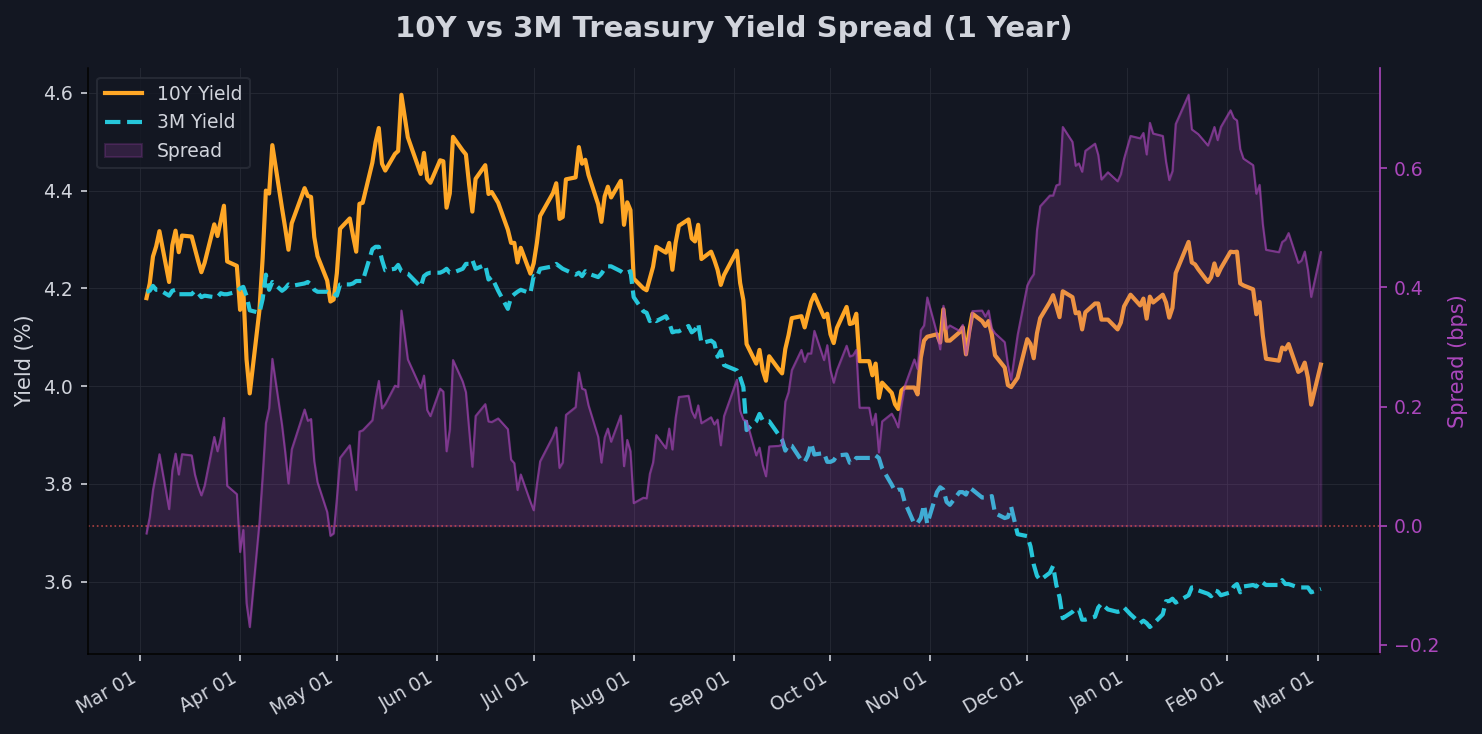
Rates & Bonds
The yield curve's finally straightening out, with the 10Y-3M spread at a positive 0.46%, like a twisted ankle that's starting to heal after inversion purgatory. The 10-year yield's dipped to 4.04, down 4.33% monthly but up 1.15% over three months, while the 3-month's at 3.58, off 4.48% in the same period. This normalization whispers recession fears might be overblown, potentially greasing the skids for equities if borrowing costs keep easing.
TLT's reflecting that bond bid, up 2.7% monthly to 89.64, just 1.3% shy of its 90.82 high, with the 20-day SMA at 88.83 and 50-day at 87.92 supporting the climb. It's above the 200-day at 86.65, signaling safety seekers are still nibbling but not panicking. For the economy, this could mean softer landing vibes, though I've watched curves uninvert right before things get spicy— think '08 flashbacks without the drama.
Overall, the curve's positive tilt suggests the bond market's betting on rate cuts without a full-blown downturn. Equities might catch a tailwind if yields keep falling, but that 12.01% drop from the 10-year's 4.6 high feels like the Fed's finally getting the room's temperature right. Watch if the spread widens further; that's the green light for risk assets.
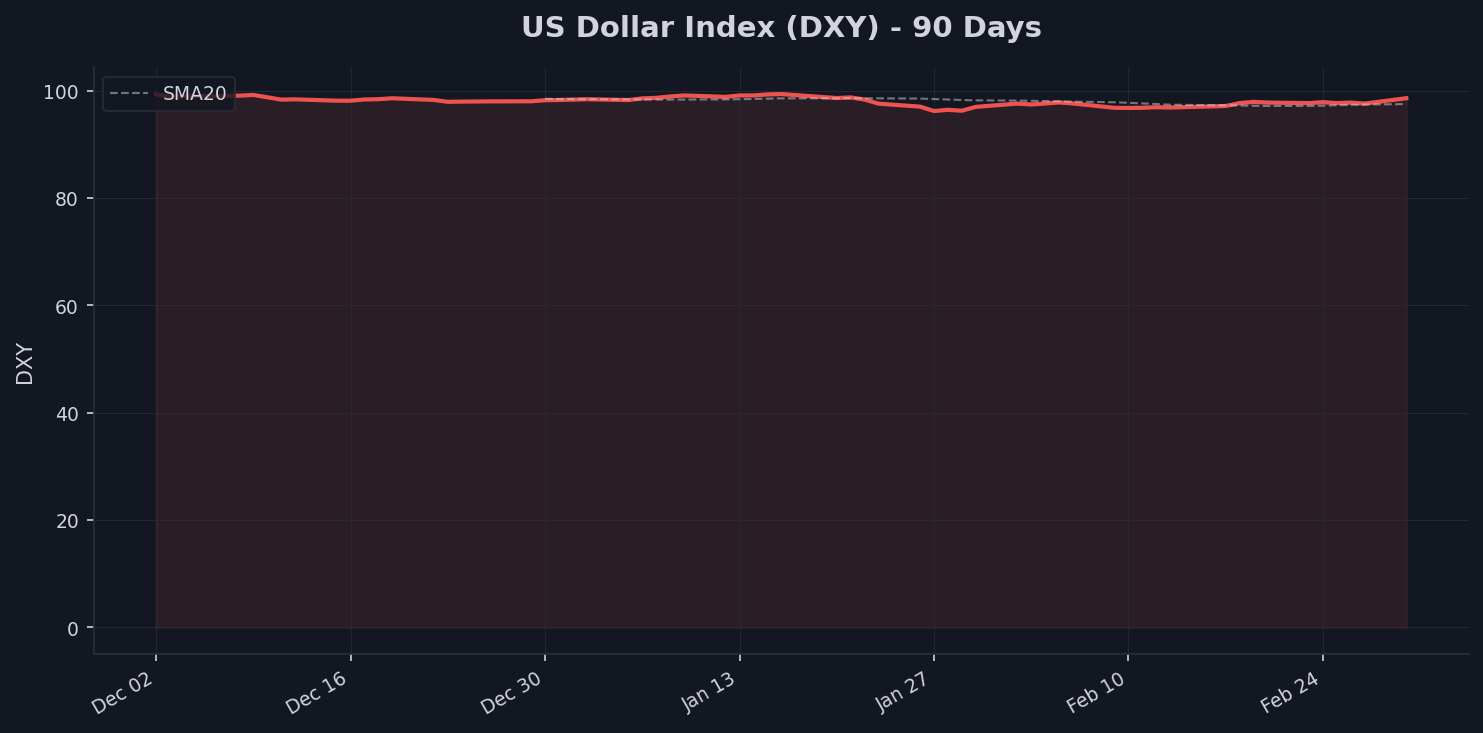
Dollar Watch
DXY's perking up to 98.61 with a 0.93% weekly gain and 2.41% monthly rise, but it's down 1% over three months and 7.63% from the 106.75 peak, like a heavyweight boxer who's lost a step. The 20-day SMA at 97.51 and 50-day at 97.93 are below current levels, hinting at short-term strength, while the 200-day at 98.42 keeps it in a tight range. This mild rebound could pressure multinational earnings, squeezing those S&P names with overseas exposure as the greenback firms.
On commodities, a stronger dollar acts like an anchor dragging on prices— gold's bucking it with that 5349.4 record, but silver's volatility shows the strain. Emerging markets might feel the pinch too, with higher dollar values making debt repayments a grind; I've seen carry trades unwind fast when DXY wakes up. The data suggests this uptick is more tactical than trend, possibly tied to yield differentials narrowing.
If I were running the book, I'd watch for DXY to test 100— a break there could ripple into lower commodity bets and EM outflows. For now, it's supporting a risk-off undercurrent without dominating the narrative. Keep tabs on Euro and Yen moves; they're the real drivers here.
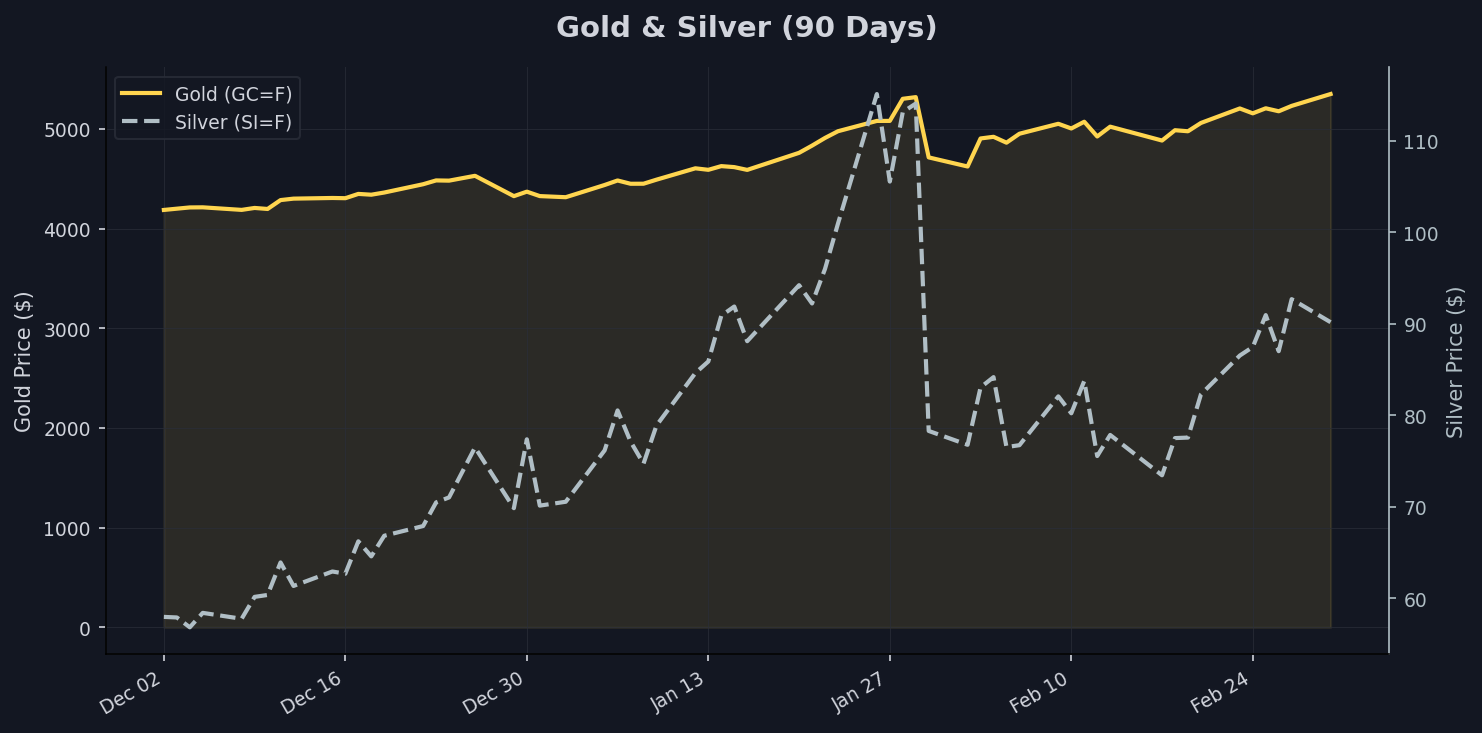
Safe Havens: Gold & Silver
Gold's on a tear, hitting an all-time high at 5349.4 with a 2.78% weekly surge and 0.58% monthly gain, but the real story's the 28.43% three-month explosion, towering over its 200-day SMA at 3943.56 like a skyscraper in a suburb. The 20-day at 5027.95 and 50-day at 4783.65 are miles below, screaming momentum that's got geopolitics and inflation hedges written all over it. This isn't just flight to safety; it's like the market's installing a panic room while the party's still going.
Silver's wilder ride— up 4.21% weekly to 90.17 but cratering 20.93% monthly, yet boasting a 70.39% three-month boom from a low of 29.12. It's 21.65% off its 115.08 high, with SMAs at 82.11 (20-day) and 83.04 (50-day) suggesting a rebound attempt above the 200-day at 52.96. The gold/silver ratio at 59.3 dips below 60, flashing risk-on signals— think speculators piling into industrial metals as growth bets heat up.
Together, they're signaling a hybrid mood: gold as the steady uncle hoarding canned goods, silver as the adrenaline junkie chasing upside. The ratio says rotation over fear, but gold's record run hints at deeper unease. I've seen this before— usually ends with commodities leading equities higher or a sharp reversal if yields spike.
Crypto & Risk Assets
Bitcoin's licking wounds at 68971.86, up 1.49% weekly but down 1.64% monthly and a hefty 20.85% over three months, 44.71% below its 124752.53 peak. The 20-day SMA at 67285.73 supports a mild bounce, but it's underwater versus the 50-day at 77275.22 and way off the 200-day at 96839.1, like a former high-flyer grounded by regulatory turbulence. That 0.04 90-day correlation with SPY screams decoupling— BTC's trading more as a speculative island than a risk asset tagalong.
Is it a store of value or just another volatility play? The data leans toward the latter, with moves divorced from equities suggesting crypto's in its own orbit, perhaps eyeing inflation hedges like gold but without the gravitas. I've watched BTC boom and bust enough to know it's sensitive to liquidity— with yields easing, there might be room for a rebound, but that monthly dip feels like lingering hangover from whatever 2025 euphoria peaked at.
Bottom line, low correlation means BTC isn't telegraphing broader market moves; it's more barometer for digital asset sentiment. If it reclaims the 50-day, watch for risk-on flows; otherwise, it's sidelined while traditional havens steal the show.
Fear Gauge: VIX
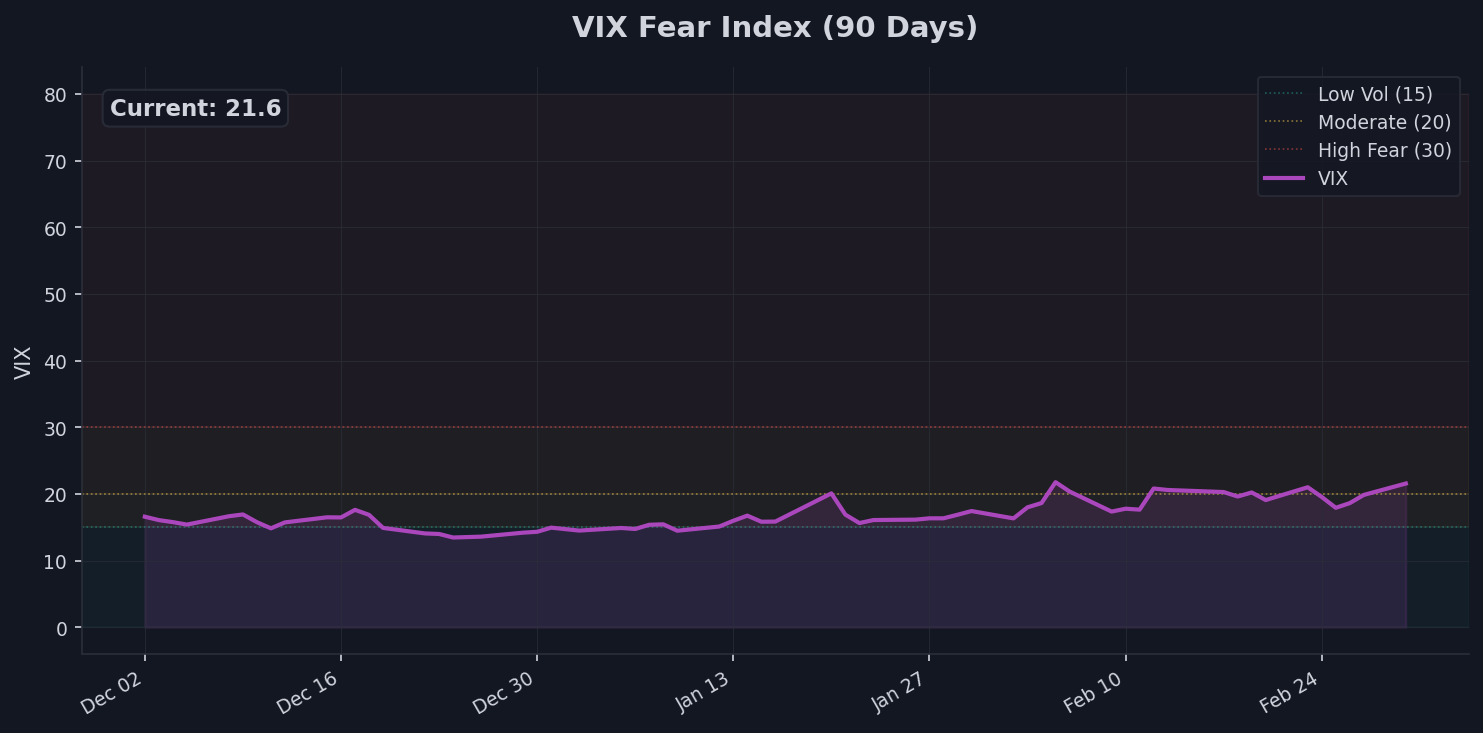
VIX is simmering at 21.57, up 2.67% weekly and a sharp 27.78% monthly, with a 25.48% three-month climb, still 58.78% below its 52.33 panic peak but well above the 13.47 low. The 20-day SMA at 19.36 and 50-day at 17.12 show it's breaking out, while the 200-day at 17.3 underscores a shift to moderate volatility from the complacency we've seen.
This elevated regime signals positioning's getting twitchy— think traders unwinding carry trades as uncertainty creeps in. It's not screaming crisis, but the spike suggests the market's bracing for bumps, like a bar tab coming due after a long night. If it holds above 20, expect choppier equities; a drop back to teens could reignite the bull.
The Bottom Line
The tape's tilting toward cautious positioning— gold's surge and yield dip scream watch for inflation signals or Fed pivots, while equities' stall hints at rotation opportunities. Traders should eye DXY breaks above 100 and VIX retreats below 20 as key triggers this week. If the curve keeps normalizing, it might unlock broader upside, but don't bet the farm yet.