Most traders pick a side on Tesla: perma-bull or doom-bear.
We built something different — a quantitative macro engine that backtested 5 years of $TSLA price action across every market regime. No opinions. No narratives. Just numbers.
The results completely changed how we trade this stock. And it's exactly why we're building a full-scale war machine to put us on the right side of the trade — every single time.
The Setup
We classified every single trading day from 2021–2026 into one of four $SPY macro regimes:
- BULL — SPY trending up with healthy market breadth
- RECOVERY — SPY turning bullish but breadth still mixed
- CORRECTION — SPY pulling back or breadth deteriorating
- BEAR — SPY in downtrend with weak internals
Then we measured exactly what $TSLA did in each one.
Every single one tracked and quantified.
Finding #1: The Regime Spread Is Absurd
This is the chart that changed everything for us:
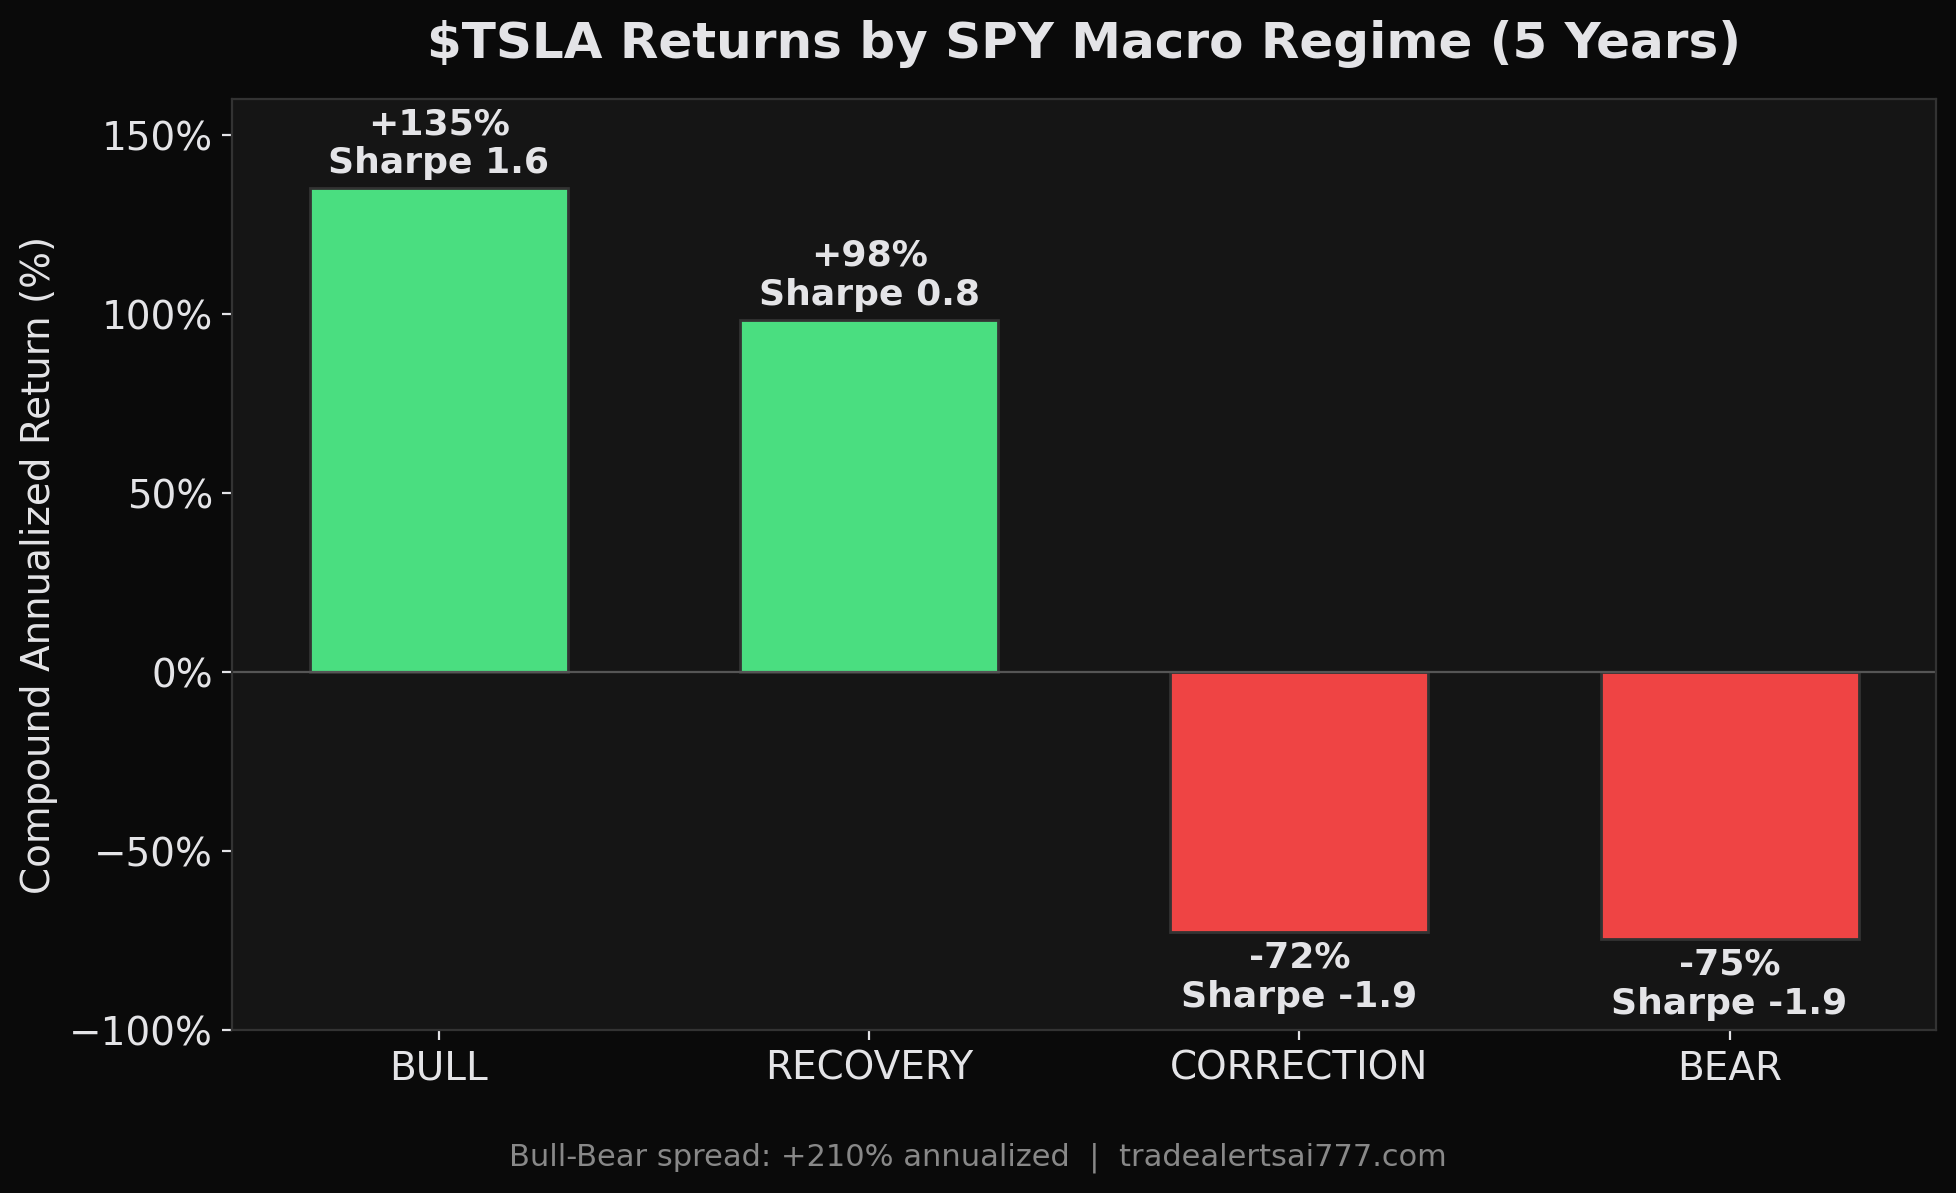
TSLA compound annualized returns by SPY regime classification (2021–2026)
That's a 210-point annualized spread between bull and bear regimes.
For context, the S&P 500's long-run average annual return is about 10%. Tesla's bull-bear spread is 21x that number. In a single stock.
Recovery regimes aren't bad either — +98% annualized with a positive Sharpe. But correction regimes are devastating: -73% annualized with a Sharpe of -1.89.
The takeaway is simple: knowing what $SPY regime you're in matters MORE for $TSLA trading than any earnings report, analyst upgrade, or Elon tweet. If the macro backdrop is bullish, TSLA prints money. If it isn't, TSLA destroys capital faster than almost any mega-cap in existence.
Finding #2: The Beta Paradox
Here's where it gets interesting.
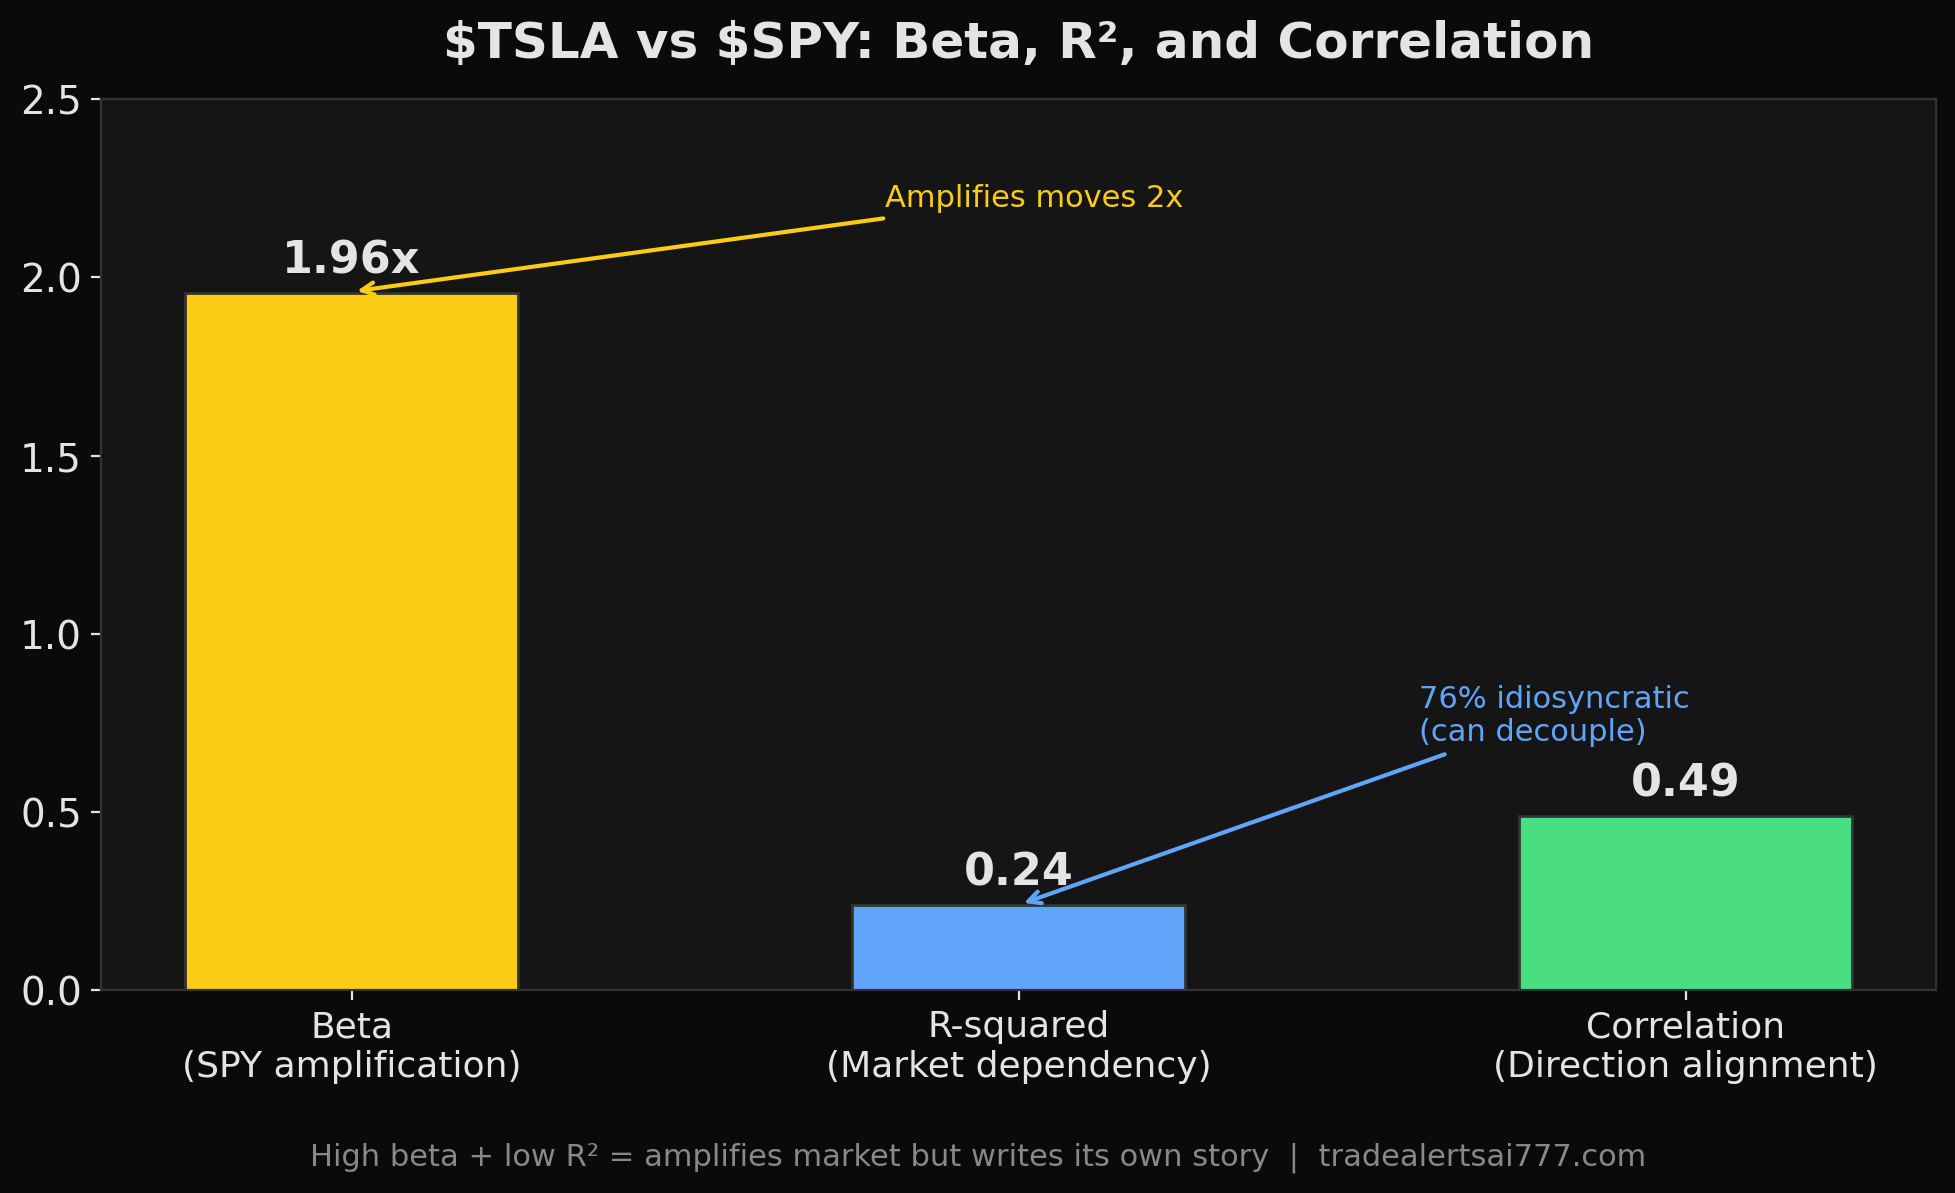
TSLA beta amplification, market dependency, and direction alignment vs SPY
$TSLA's beta to $SPY over the full 5 years: 1.96x
That means when SPY moves 1%, TSLA moves roughly 2%. Classic high-beta behavior.
But the R-squared? Just 0.24.
That's the paradox. Beta tells you the amplification factor. R-squared tells you how much of TSLA's movement is actually explained by the market.
An R-squared of 0.24 means 76% of TSLA's daily moves have nothing to do with SPY.
Tesla amplifies the market when they move together — but it also writes its own story three-quarters of the time. Earnings, robotaxi timelines, energy storage contracts, Elon's latest post — these create massive moves that the S&P can't explain.
This is why regime analysis matters even more for TSLA than for a typical high-beta stock. When the market drives the bus, TSLA is in the back seat with a 2x amplifier. But most days, TSLA is driving its own car entirely.
Finding #3: The Drawdown Reality Check
If you're going to trade TSLA — especially on the long side — you need to understand what you're signing up for.
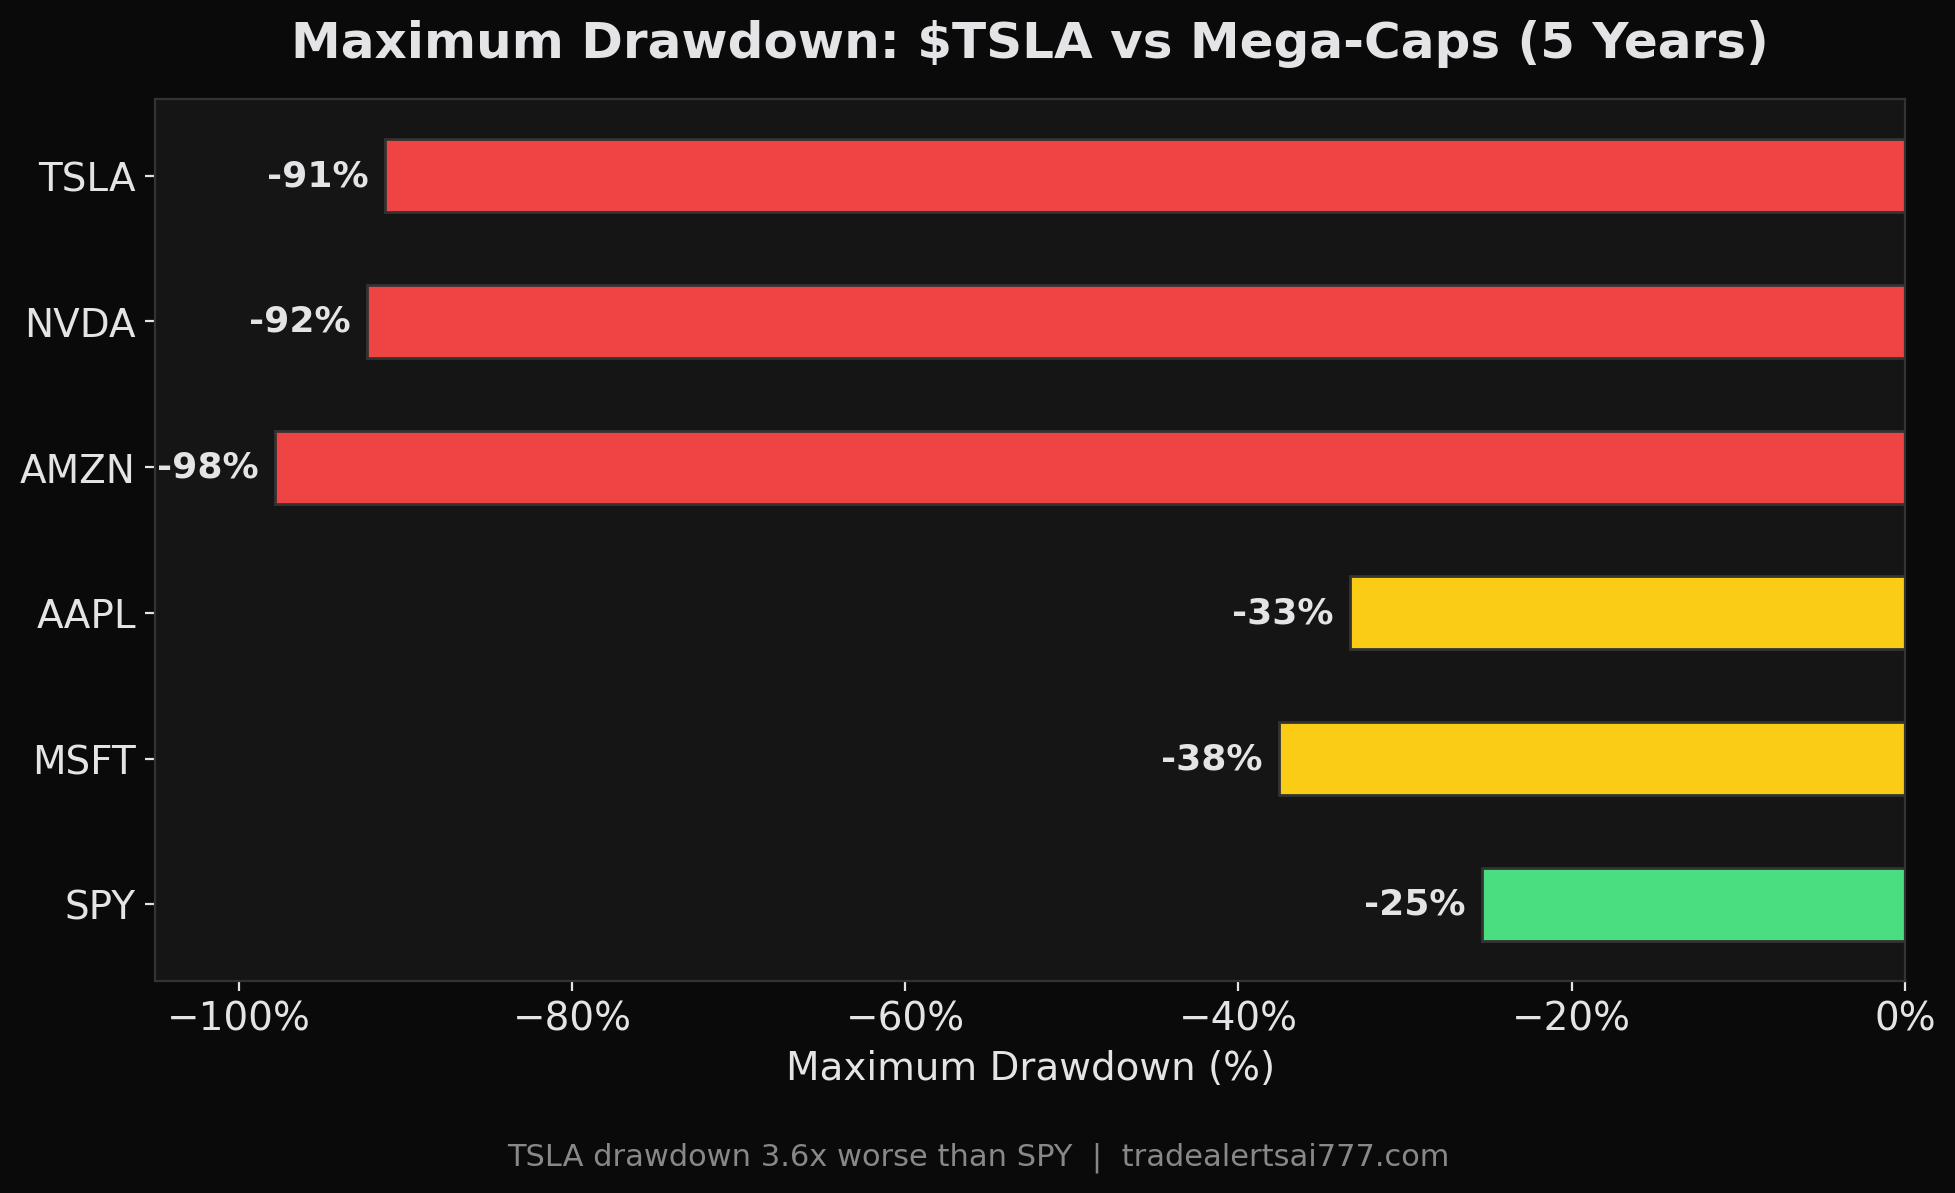
Maximum drawdowns over 5 years across mega-cap names
TSLA's max drawdown is 3.6x worse than SPY's.
But here's the thing most people miss: TSLA's drawdown profile is nearly identical to NVDA and AMZN. All three are hyper-growth names that experienced 90%+ drawdowns. The difference is that AAPL and MSFT — the mature mega-caps — maxed out around -35%.
This tells you something critical about position sizing. If you're holding TSLA like you'd hold AAPL, you're making a serious risk management mistake. A 91% drawdown means a $100K position goes to $8,800.
That doesn't mean you can't trade it profitably. It means you need to size it like the high-vol asset it actually is — and wait for the regime to confirm before going heavy.
Finding #4: The AI Bust Thesis (And Why TSLA Survives)
This is the contrarian take.
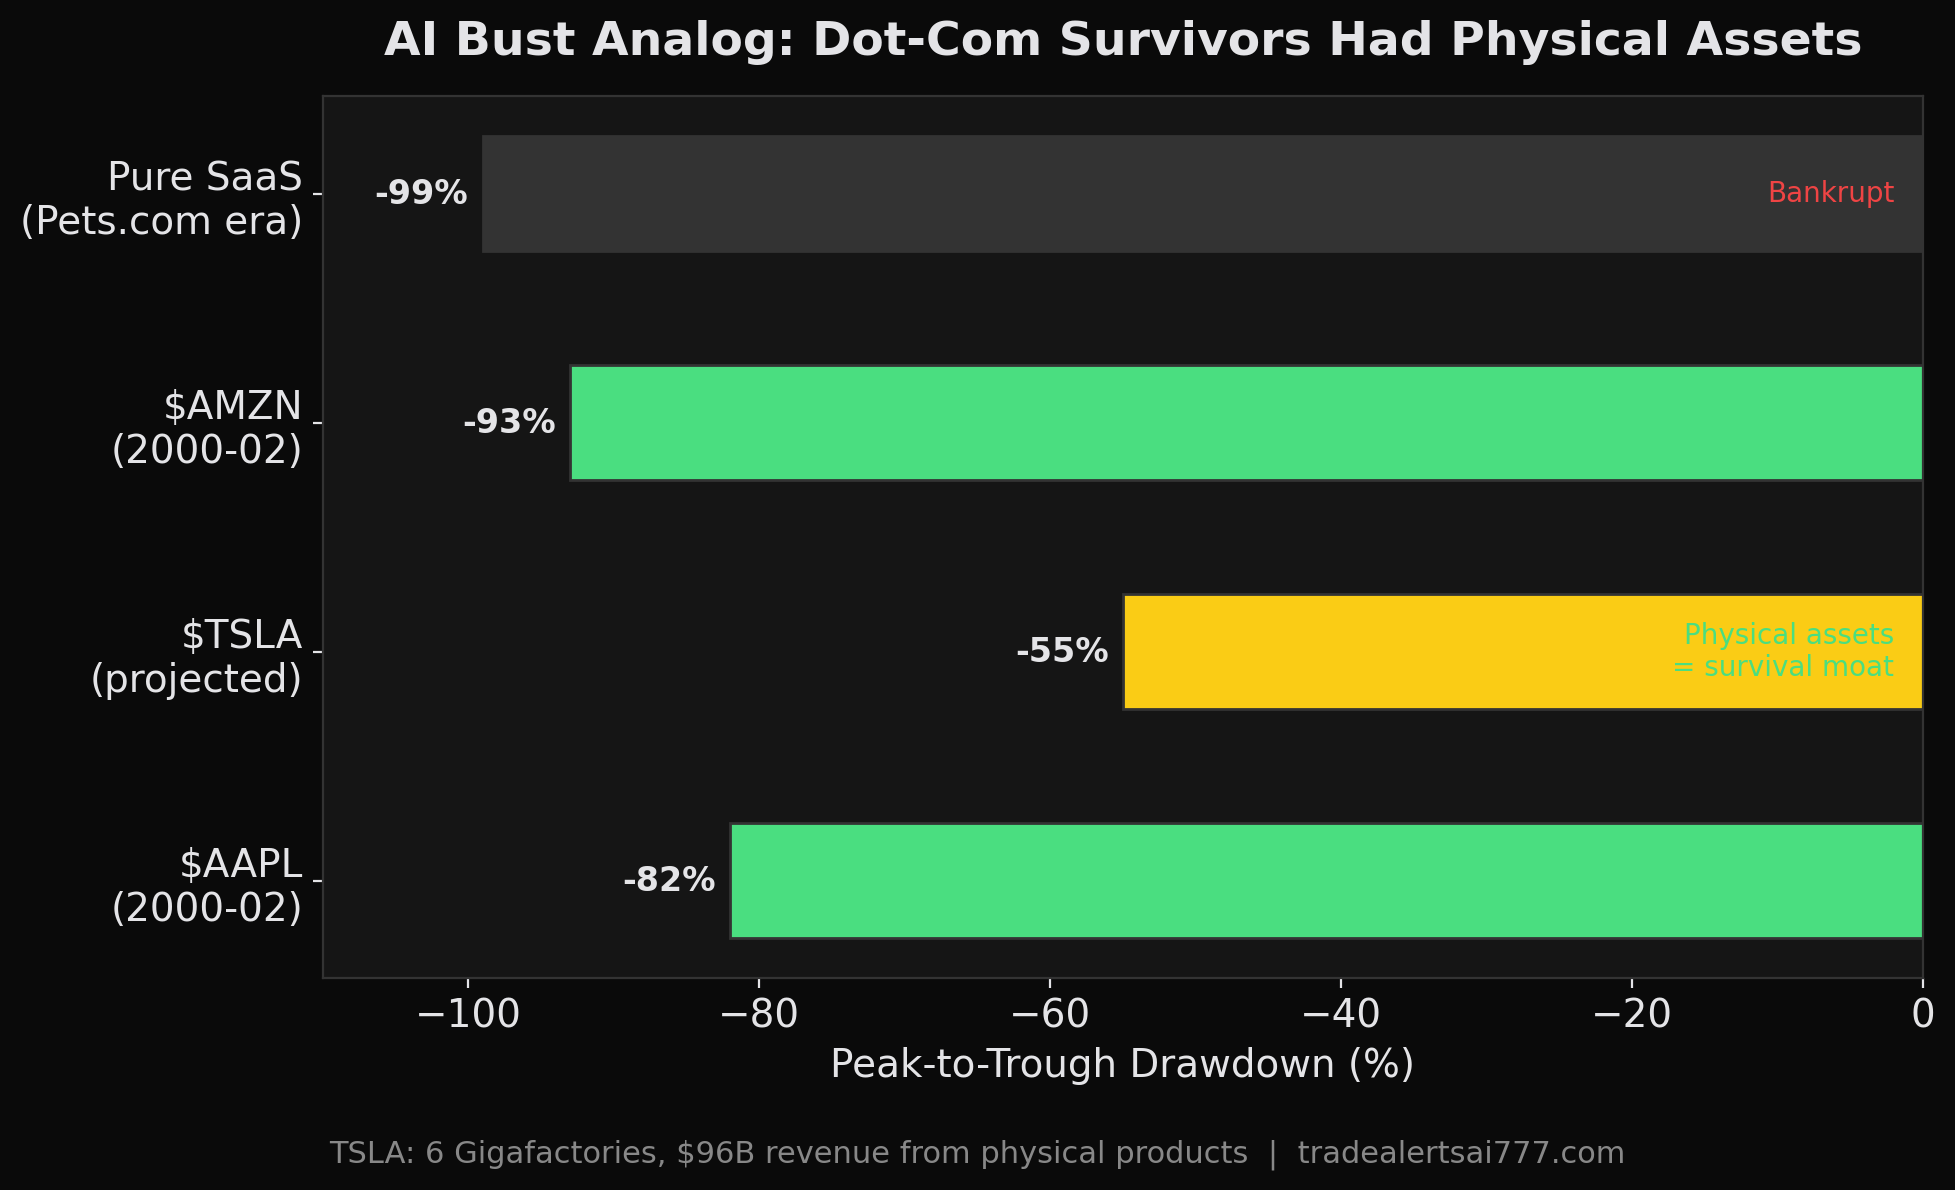
Companies with physical assets survived 90%+ drawdowns in the dot-com bust and recovered to new highs
Every major tech bubble produces two kinds of companies:
- Pure-play narratives that collapse to zero (Pets.com, most SPACs)
- Real-asset companies that crater 80-90% and then recover to new all-time highs
Amazon dropped 93% from 2000 to 2002. But it had warehouses, logistics infrastructure, and real revenue. It survived. Today it's worth $2T+.
Apple dropped 82% in the same crash. It had hardware, retail stores, and a brand. It survived. Today it's worth $3T+.
Now look at TSLA.
If (when?) the AI hype cycle corrects — and every hype cycle eventually does — TSLA will get hit. Hard. Maybe another 50-60% from current levels.
But Tesla has something most AI-narrative stocks don't: physical assets.
- 6 Gigafactories across 4 continents
- $96 billion in annual revenue from cars people actually drive
- An energy storage business growing 100%+ YoY
- A charging network that even competitors are adopting
Compare that to a pure-software AI company with no physical moat and zero switching costs.
In a dot-com-style AI bust, TSLA has the Amazon playbook: crater, survive on real assets, recover when the narrative resets.
Why We're Building This: The Macro Engine
Let's be real. $TSLA is our favorite stock. We're long-term holders. We're not here to scalp a few points — we're waiting for the moment the data tells us to go all-in on call options.
That moment is when regime, flow, GEX positioning, and macro signals ALL align.
That's exactly what we're building at TradeAlerts — a full macro engine that synthesizes 14 different signal sources into one composite score:
- Options flow (institutional sweep detection)
- GEX & dealer positioning (gamma exposure mapping)
- Dark pool activity (smart money footprint)
- Market breadth & sector rotation
- Economic regime classification (FRED data, yield curves)
- Prediction market odds (Polymarket integration)
- Gap study probabilities
- And more
The engine doesn't guess. It reads the tape across every dimension and tells us: is the macro backdrop favorable or not? If the Sharpe spread between bull and bear is 3.5 points, we better be damn sure which regime we're in before we pull the trigger.
$TSLA Is Just the Beginning
We're expanding this full war machine — regime classification, flow detection, GEX mapping, the entire arsenal — into other high-conviction tickers. The same quantitative framework that produces a 1.59 Sharpe in bull regimes for TSLA can be applied across the board.
More analysis and results will be shared exclusively with founding members as we roll out coverage.
How We Actually Trade This
- 1 Regime gates everything. Our swing tracker checks the macro regime before every TSLA trade. In BULL or RECOVERY regimes, put-selling strategies are active. In CORRECTION or BEAR, they're automatically blocked. No exceptions.
- 2 Gap-downs in bull regimes are snap-back setups. When TSLA gaps down 3%+ during a confirmed bull regime, historical data shows these are high-probability recovery trades.
- 3 Size for the drawdown, not the upside. TSLA can draw down 91%. Size your position so that worst case doesn't blow up your portfolio. If a 50% drawdown on your TSLA allocation would hurt, you're too large.
- 4 R-squared of 0.24 means stock-specific catalysts dominate. Don't just watch SPY when you trade TSLA. 76% of the daily moves are idiosyncratic. The macro regime sets the baseline, but TSLA-specific catalysts create the actual trades.
What's Next
The detailed analysis, real-time macro signals, regime alerts, and expanded ticker coverage will be available exclusively to our founding members.
Get the Full War Machine
Live regime classification. Gap-down snap-back alerts. Full GEX + flow + dealer positioning for 100+ tickers. The macro composite signal that powers everything above.
Become a Founding Member$39.99/month • The data does the talking