Executive Summary
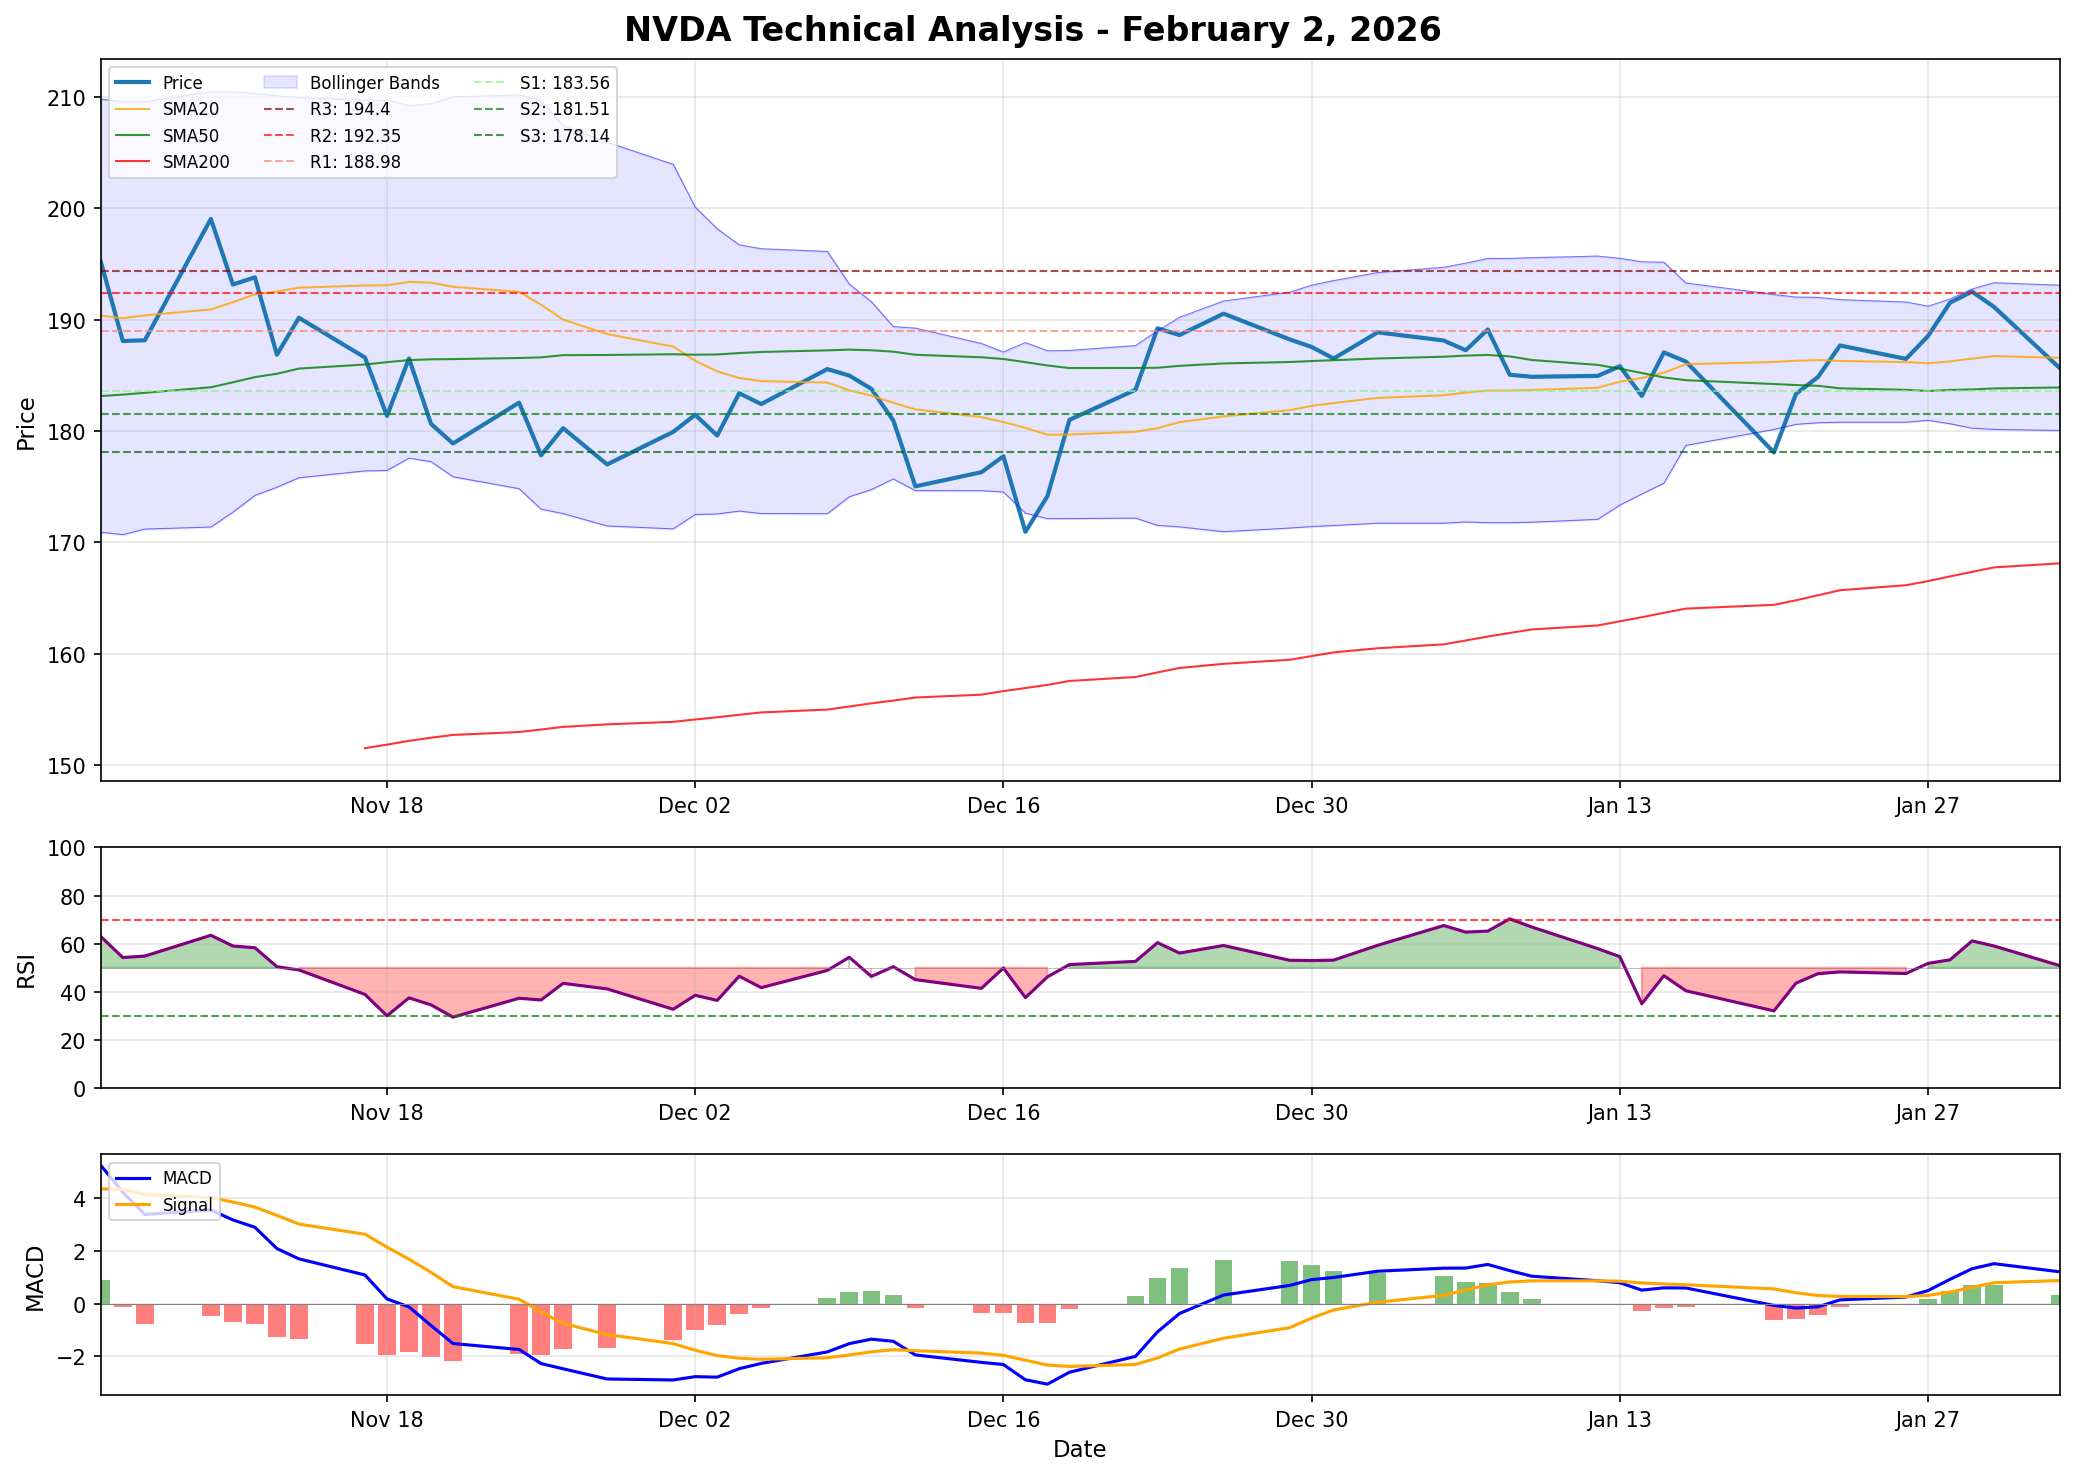
NVIDIA (NVDA) is trading at $185.61, maintaining a BULLISH trend across all timeframes. The stock is positioned above all major moving averages (20, 50, and 200 SMA), with MACD showing bullish momentum. RSI is neutral at 50.83, providing room for upside without overbought concerns. This represents one of the cleaner technical setups for continuation trades.
Key Levels for NVDA
Support and Resistance
| Level | Type | Price |
|---|---|---|
| R3 | Strong Resistance | $194.40 |
| R2 | Resistance | $192.35 |
| R1 | Near Resistance | $188.98 |
| Current | Price | $185.61 |
| S1 | Near Support | $183.56 |
| S2 | Support | $181.51 |
| S3 | Strong Support | $178.14 |
Pivot Points
| Timeframe | Pivot | R1 | S1 |
|---|---|---|---|
| Daily | $186.93 | $188.98 | $183.56 |
| Weekly | $186.93 | $188.98 | $183.56 |
Moving Averages
| Indicator | Value | Position vs Price |
|---|---|---|
| SMA 20 | $186.56 | Just Above (Neutral) |
| SMA 50 | $183.90 | Below (Bullish) |
| SMA 200 | $168.11 | Below (Bullish) |
| EMA 20 | $186.89 | Just Above (Neutral) |
| EMA 50 | $185.50 | Near Price (Neutral) |
| EMA 200 | $169.64 | Below (Bullish) |
Bollinger Bands
- Upper Band: $193.09
- Middle Band: $186.56
- Lower Band: $180.03
Price is consolidating near the middle of the Bollinger Bands, suggesting potential for expansion in either direction but with bullish bias given trend structure.
Technical Setup
RSI Analysis
- Current RSI: 50.83
- Signal: NEUTRAL
- Interpretation: RSI is perfectly balanced at the 50 level, providing ample room for upside movement without overbought risk. This is an ideal setup for trend continuation.
MACD Analysis
- MACD Line: 1.21
- Signal Line: 0.88
- Histogram: 0.33
- Signal: BULLISH
- Interpretation: MACD is above the signal line with positive histogram, confirming bullish momentum. The positive crossover supports continuation higher.
Trend Analysis
- Primary Trend (200 SMA): BULLISH - Price well above 200 SMA ($168.11)
- Secondary Trend (50 SMA): BULLISH - Price above 50 SMA ($183.90)
- Short-term Trend (20 SMA): Neutral - Price at 20 SMA ($186.56)
Volume Analysis
- Current Volume: 160.11M
- Average Volume: 209.92M
- Volume Ratio: 0.76x
- Interpretation: Slightly below-average volume during consolidation is normal. Watch for volume expansion on breakout above R1.
52-Week Range
- 52-Week High: $212.18
- 52-Week Low: $86.60
- Current Position: 12.5% from 52-week high
Trading Strategy
Bias: LONG
NVDA presents a textbook bullish continuation setup with price above all major moving averages and positive MACD momentum.
Entry Points
- Primary Entry: $183.56 (S1 pullback entry)
- Breakout Entry: Above $189.00 (R1 breakout confirmation)
- Current Entry: $185.61 (momentum entry with immediate stop)
Stop Loss
- Conservative: $181.51 (S2)
- Moderate: $183.00 (just below S1)
- Tight: $180.00 (below lower Bollinger Band)
Take Profit Targets
- Target 1: $188.98 (R1) - Conservative
- Target 2: $192.35 (R2) - Moderate
- Target 3: $194.40 (R3) - Aggressive
- Extended Target: $200.00 (psychological level)
Risk/Reward Analysis
- Risk (Entry to Stop): $4.10 per share
- Reward (Entry to T1): $3.37 per share
- Risk/Reward Ratio: 1:0.82 (improve with S1 entry)
Optimized Entry at S1 ($183.56):
- Risk: $2.05 (to $181.51)
- Reward: $5.42 (to R1)
- Improved R/R: 1:2.64
Options Strategy
Recommended: Buy ATM Calls or Bull Call Spread
Given the bullish trend with neutral RSI:
Buy ATM Call (Strike ~$185, 30-45 DTE)
- Pure directional play on continued uptrend
- Benefits from potential move to $190-195 range
- Maximum loss limited to premium
Bull Call Spread ($185/$195, 30-45 DTE)
- Reduced cost basis
- Defined risk and reward
- Target R2-R3 zone for maximum profit
Cash-Secured Put (Strike $180, 30-45 DTE)
- Collect premium while waiting for pullback entry
- Willing to own shares at $180 support level
- Income generation in consolidation
Key Catalysts
- AI/GPU demand reports
- Data center spending trends
- Earnings announcements
- New product launches
Risk Factors
- Technical Risk: Break below $181.51 (S2) would signal trend weakness
- Valuation Risk: High P/E multiple leaves little room for disappointment
- Competition Risk: AMD and custom AI chips from hyperscalers
- Macro Risk: Tech sector rotation or broader market correction
- Export Restrictions: Ongoing China chip export limitations
Sector Context
NVDA remains the dominant AI infrastructure play with:
- Market leadership in GPU/AI accelerators
- Strong data center revenue growth
- Software ecosystem (CUDA) moat
- Diversification into automotive, gaming, and professional visualization
Conclusion
NVDA offers one of the cleanest bullish technical setups in the market. With price above all major moving averages, bullish MACD, and neutral RSI, the path of least resistance is higher. The ideal strategy is to either buy on pullbacks to S1 ($183.56) or enter on breakout confirmation above R1 ($189). Risk management is straightforward with clear support levels for stop placement.
Disclaimer: This analysis is for educational purposes only and does not constitute financial advice. Always do your own research and consult with a qualified financial advisor before making investment decisions.