Executive Summary
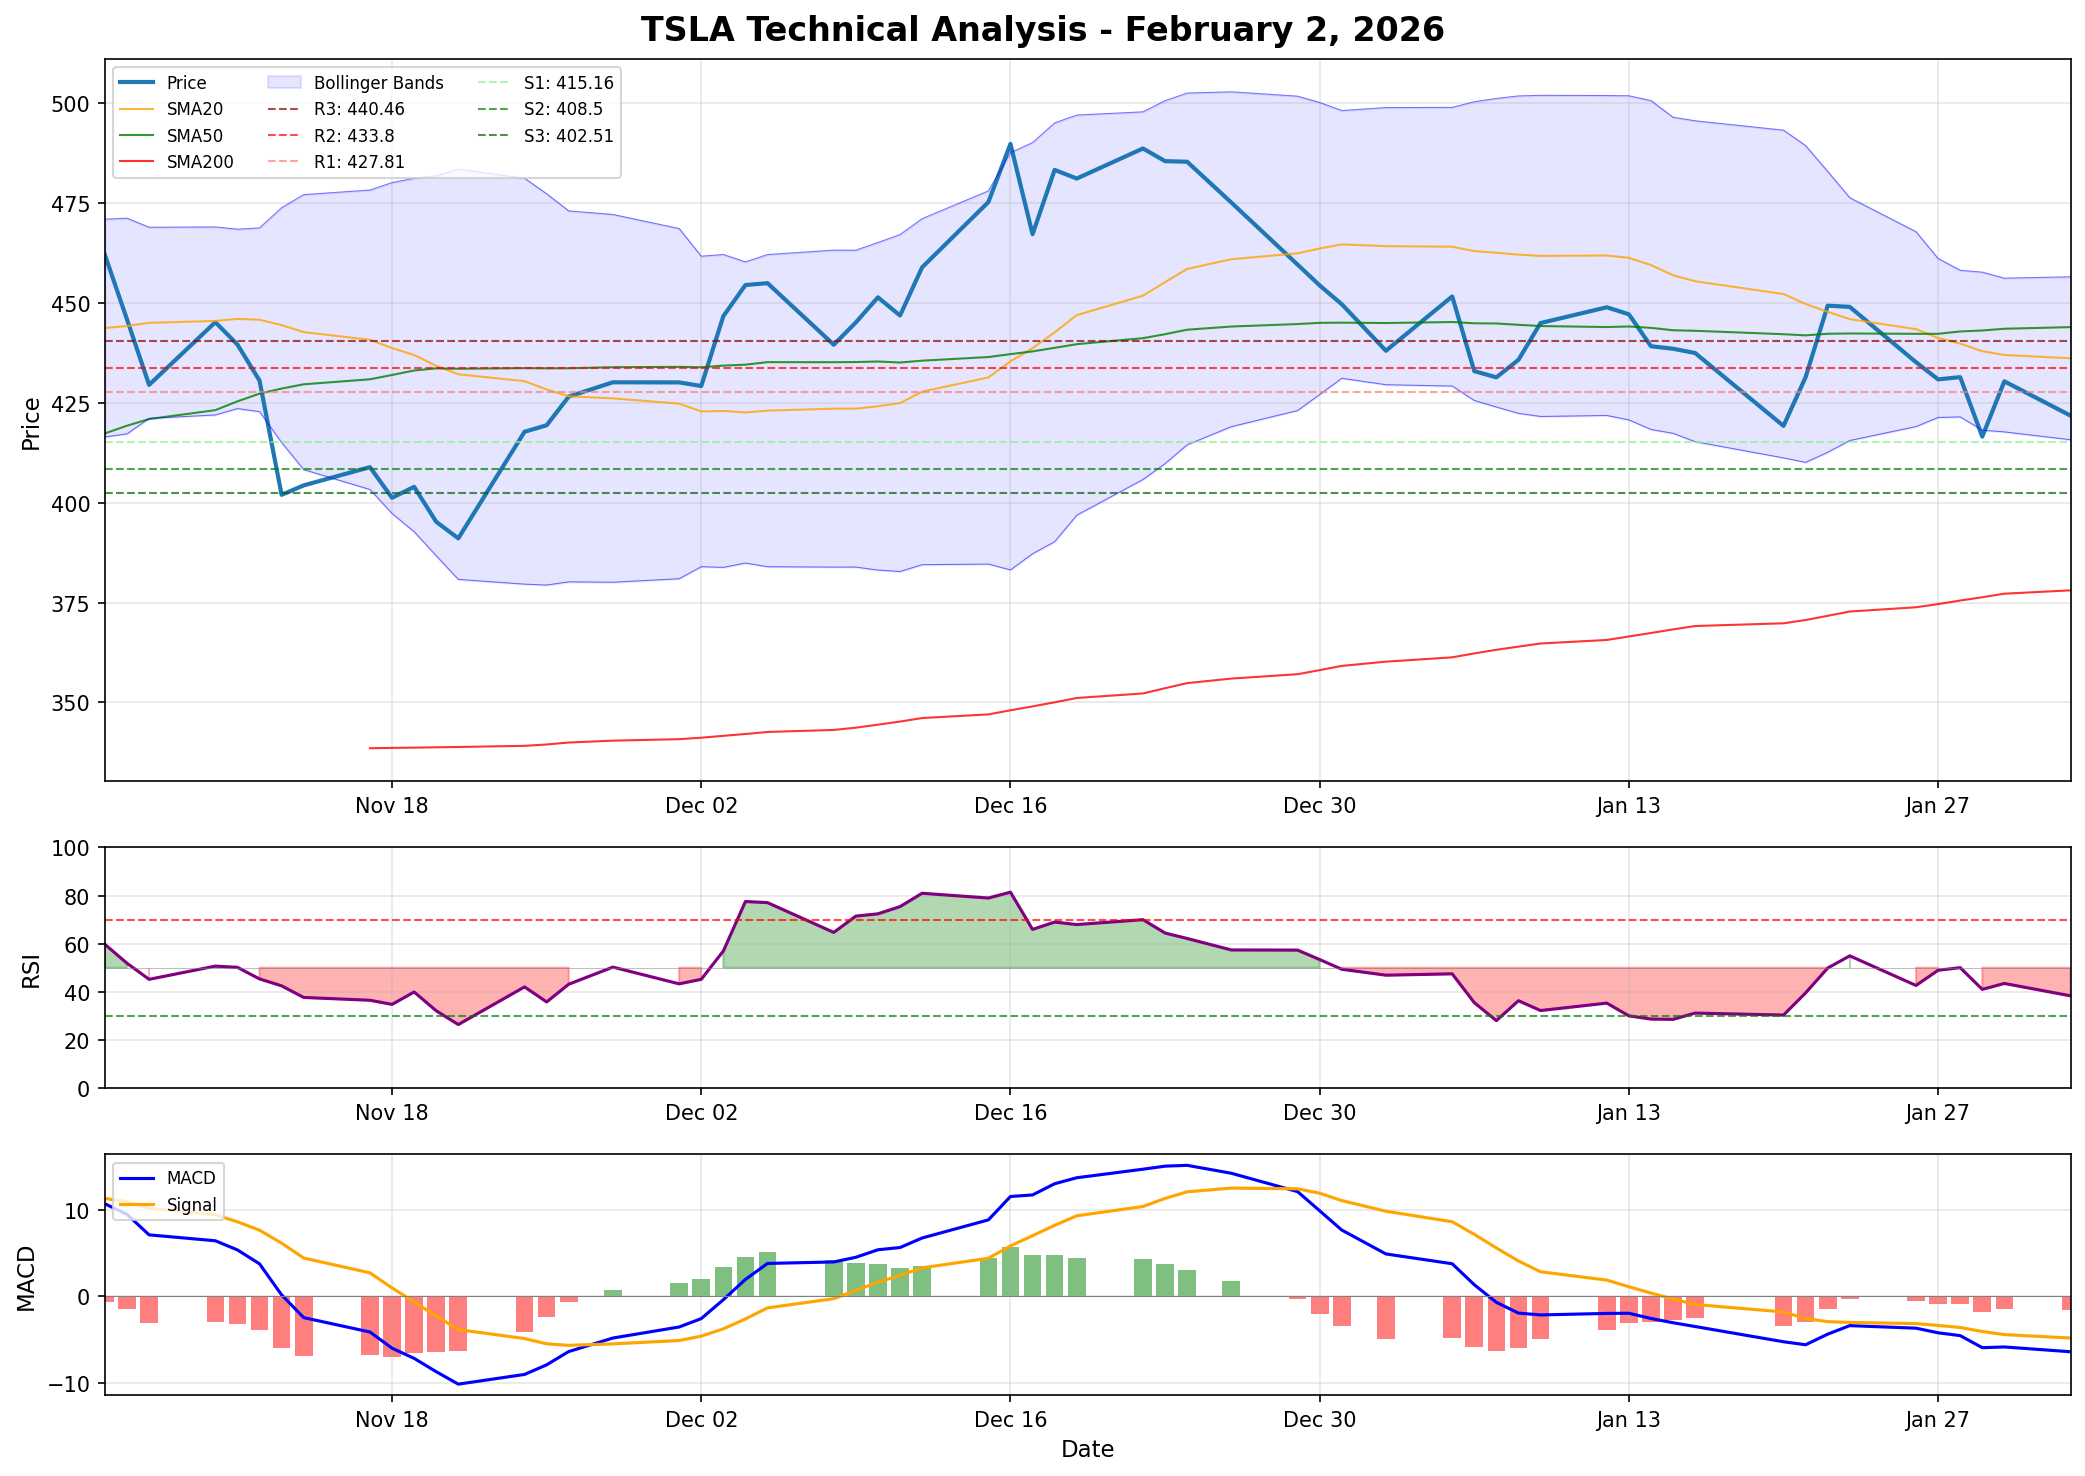
Tesla (TSLA) is currently trading at $421.81, showing a BULLISH long-term trend while experiencing short-term weakness. The stock remains above its 200-day moving average ($378.06) but has pulled back below both the 20-day and 50-day SMAs, creating a potential buy-the-dip opportunity for trend-following traders.
Key Levels for TSLA
Support and Resistance
| Level | Type | Price |
|---|---|---|
| R3 | Strong Resistance | $440.46 |
| R2 | Resistance | $433.80 |
| R1 | Near Resistance | $427.81 |
| Current | Price | $421.81 |
| S1 | Near Support | $415.16 |
| S2 | Support | $408.50 |
| S3 | Strong Support | $402.51 |
Pivot Points
| Timeframe | Pivot | R1 | S1 |
|---|---|---|---|
| Daily | $421.15 | $427.81 | $415.16 |
| Weekly | $421.15 | $427.81 | $415.16 |
Moving Averages
| Indicator | Value | Position vs Price |
|---|---|---|
| SMA 20 | $436.19 | Above (Bearish) |
| SMA 50 | $443.99 | Above (Bearish) |
| SMA 200 | $378.06 | Below (Bullish) |
| EMA 20 | $436.67 | Above (Bearish) |
| EMA 50 | $439.37 | Above (Bearish) |
| EMA 200 | $399.37 | Below (Bullish) |
Bollinger Bands
- Upper Band: $456.59
- Middle Band: $436.19
- Lower Band: $415.78
Price is currently near the lower Bollinger Band, suggesting potential oversold conditions on the short-term timeframe.
Technical Setup
RSI Analysis
- Current RSI: 38.32
- Signal: NEUTRAL (approaching oversold)
- Interpretation: RSI is below 50 but above the oversold threshold of 30, indicating bearish momentum is present but not extreme.
MACD Analysis
- MACD Line: -6.41
- Signal Line: -4.82
- Histogram: -1.58
- Signal: BEARISH
- Interpretation: MACD is below the signal line with expanding negative histogram, confirming short-term bearish momentum.
Trend Analysis
- Primary Trend (200 SMA): BULLISH - Price above 200 SMA
- Secondary Trend (50 SMA): Bearish - Price below 50 SMA
- Short-term Trend (20 SMA): Bearish - Price below 20 SMA
Volume Analysis
- Current Volume: 55.85M
- Average Volume: 96.59M
- Volume Ratio: 0.58x
- Interpretation: Below-average volume on the pullback is constructive for bulls, suggesting lack of aggressive selling.
52-Week Range
- 52-Week High: $498.83
- 52-Week Low: $214.25
- Current Position: 48.3% from 52-week high
Trading Strategy
Bias: LONG
Given the bullish long-term structure (price above 200 SMA) combined with short-term pullback near support, the setup favors buying the dip.
Entry Points
- Primary Entry: $415.78 (Lower Bollinger Band / S1 confluence)
- Aggressive Entry: Current price ($421.81) with tight stop
Stop Loss
- Conservative: $408.50 (S2)
- Tight: $415.00 (just below S1)
Take Profit Targets
- Target 1: $427.81 (R1) - Conservative
- Target 2: $433.80 (R2) - Moderate
- Target 3: $440.46 (R3) - Aggressive
Risk/Reward Analysis
- Risk (Entry to Stop): $7.28 per share
- Reward (Entry to T1): $12.03 per share
- Risk/Reward Ratio: 1:1.65
Options Strategy
Recommended: Bull Call Spread or Buy ATM Calls
Given the bullish bias with neutral RSI, consider:
Buy ATM Call (Strike ~$420-425, 30-45 DTE)
- Directional bet on rebound to resistance levels
- Maximum loss limited to premium paid
Bull Call Spread ($420/$440, 30-45 DTE)
- Lower cost entry
- Capped upside at $440
- Better for defined-risk traders
Key Dates to Watch
- Earnings season catalyst potential
- Any EV-related policy announcements
- Delivery numbers releases
Risk Factors
- Technical Risk: Break below $408.50 (S2) would invalidate bullish thesis
- Sector Risk: EV competition intensifying
- Macro Risk: Interest rate sensitivity for growth stocks
- Company-specific: Execution risk on new models/features
Conclusion
TSLA presents a potential long opportunity for traders looking to buy the dip in a stock that maintains its bullish long-term structure. The key is waiting for confirmation of support at the $415-416 area or entering with disciplined stop-loss management. Short-term momentum is bearish, so patience and proper risk management are essential.
Disclaimer: This analysis is for educational purposes only and does not constitute financial advice. Always do your own research and consult with a qualified financial advisor before making investment decisions.