Deep Market Analysis - February 2, 2026
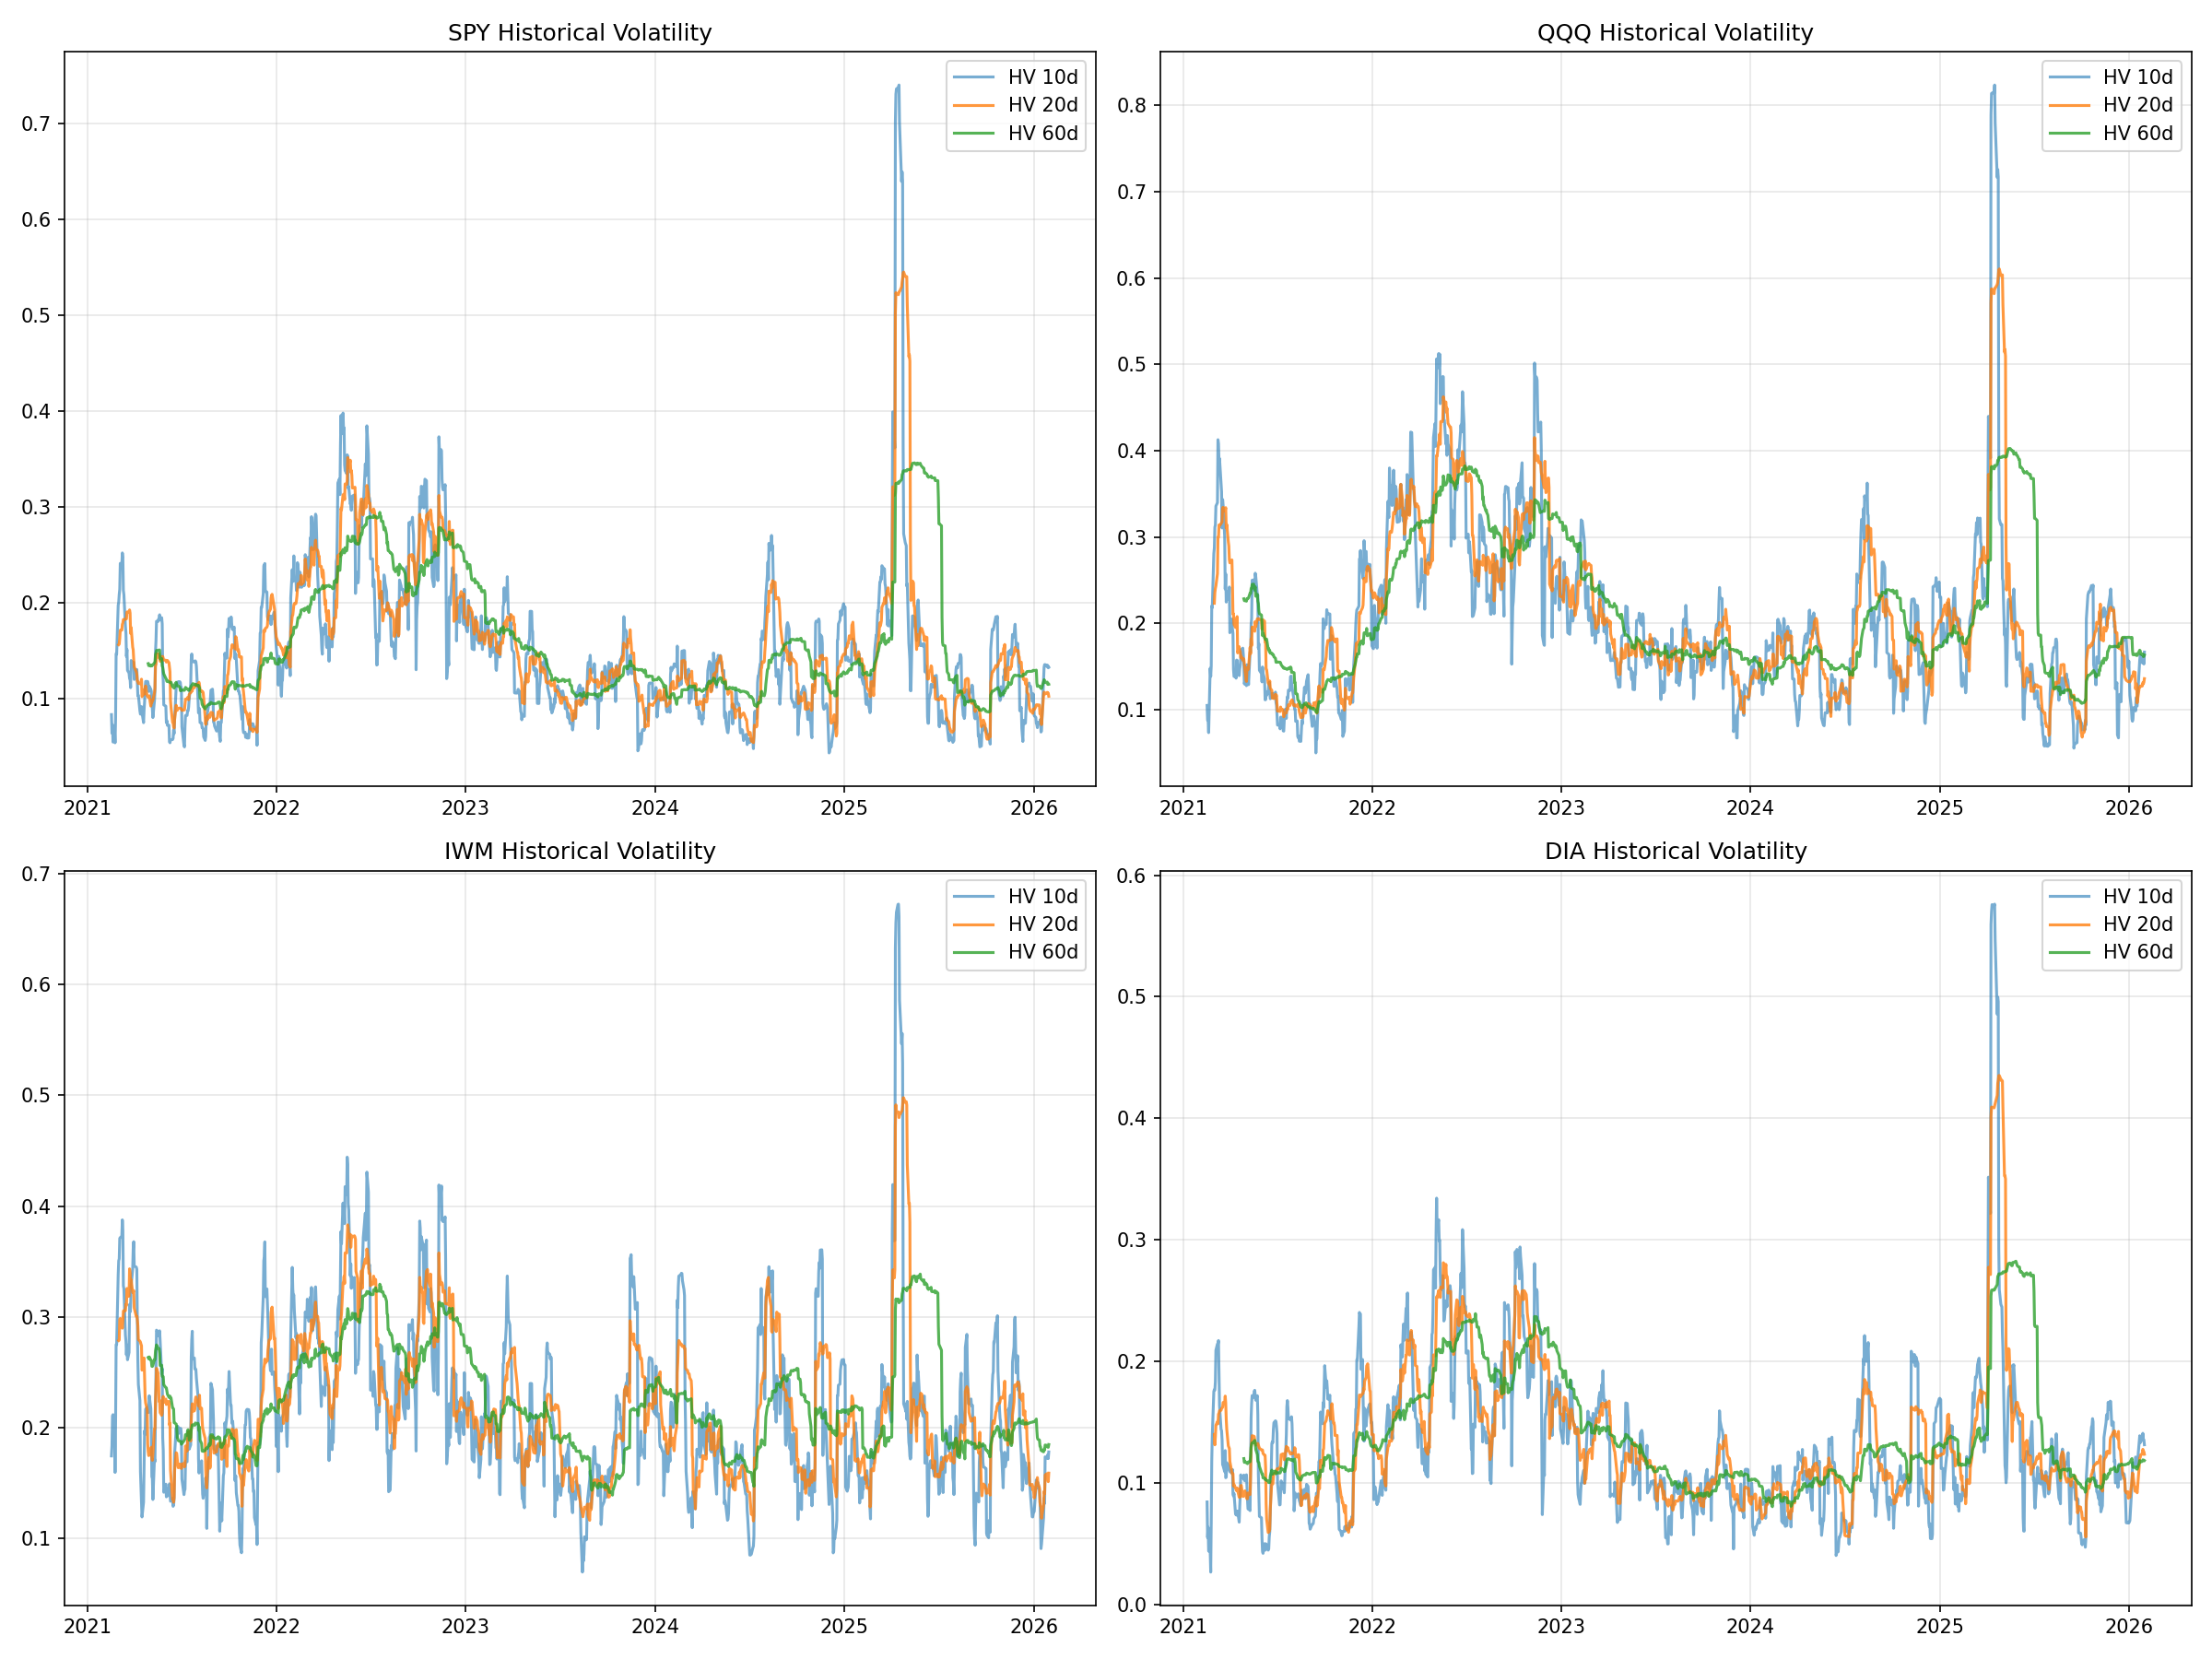
Executive Summary Our quant agent completed a comprehensive market analysis covering SPY, QQQ, IWM, and DIA. This report documents volatility regimes, options flow patterns, and correlation dynamics as of February 2, 2026. Volatility Analysis The following chart shows multi-timeframe volatility analysis across our coverage universe. We analyze historical volatility using 10, 20, 30, and 60-day windows to identify volatility regimes and potential mean-reversion opportunities. Key Findings Symbol HV20 Volatility Regime SPY 10.3% Low volatility QQQ 13.6% Normal IWM 15.9% Elevated DIA 12.4% Normal Returns Distribution Understanding the distribution of returns helps calibrate position sizing and risk management. The following analysis shows return distributions with fitted normal curves for comparison. ...